Dashboards — Multi-Cluster Kubernetes Monitoring
KubeStellar Console has 28+ dashboards for multi-cluster Kubernetes monitoring. Each dashboard gives you fleet-wide visibility into a specific operational area across all your connected clusters.
Main Dashboard
Route: /
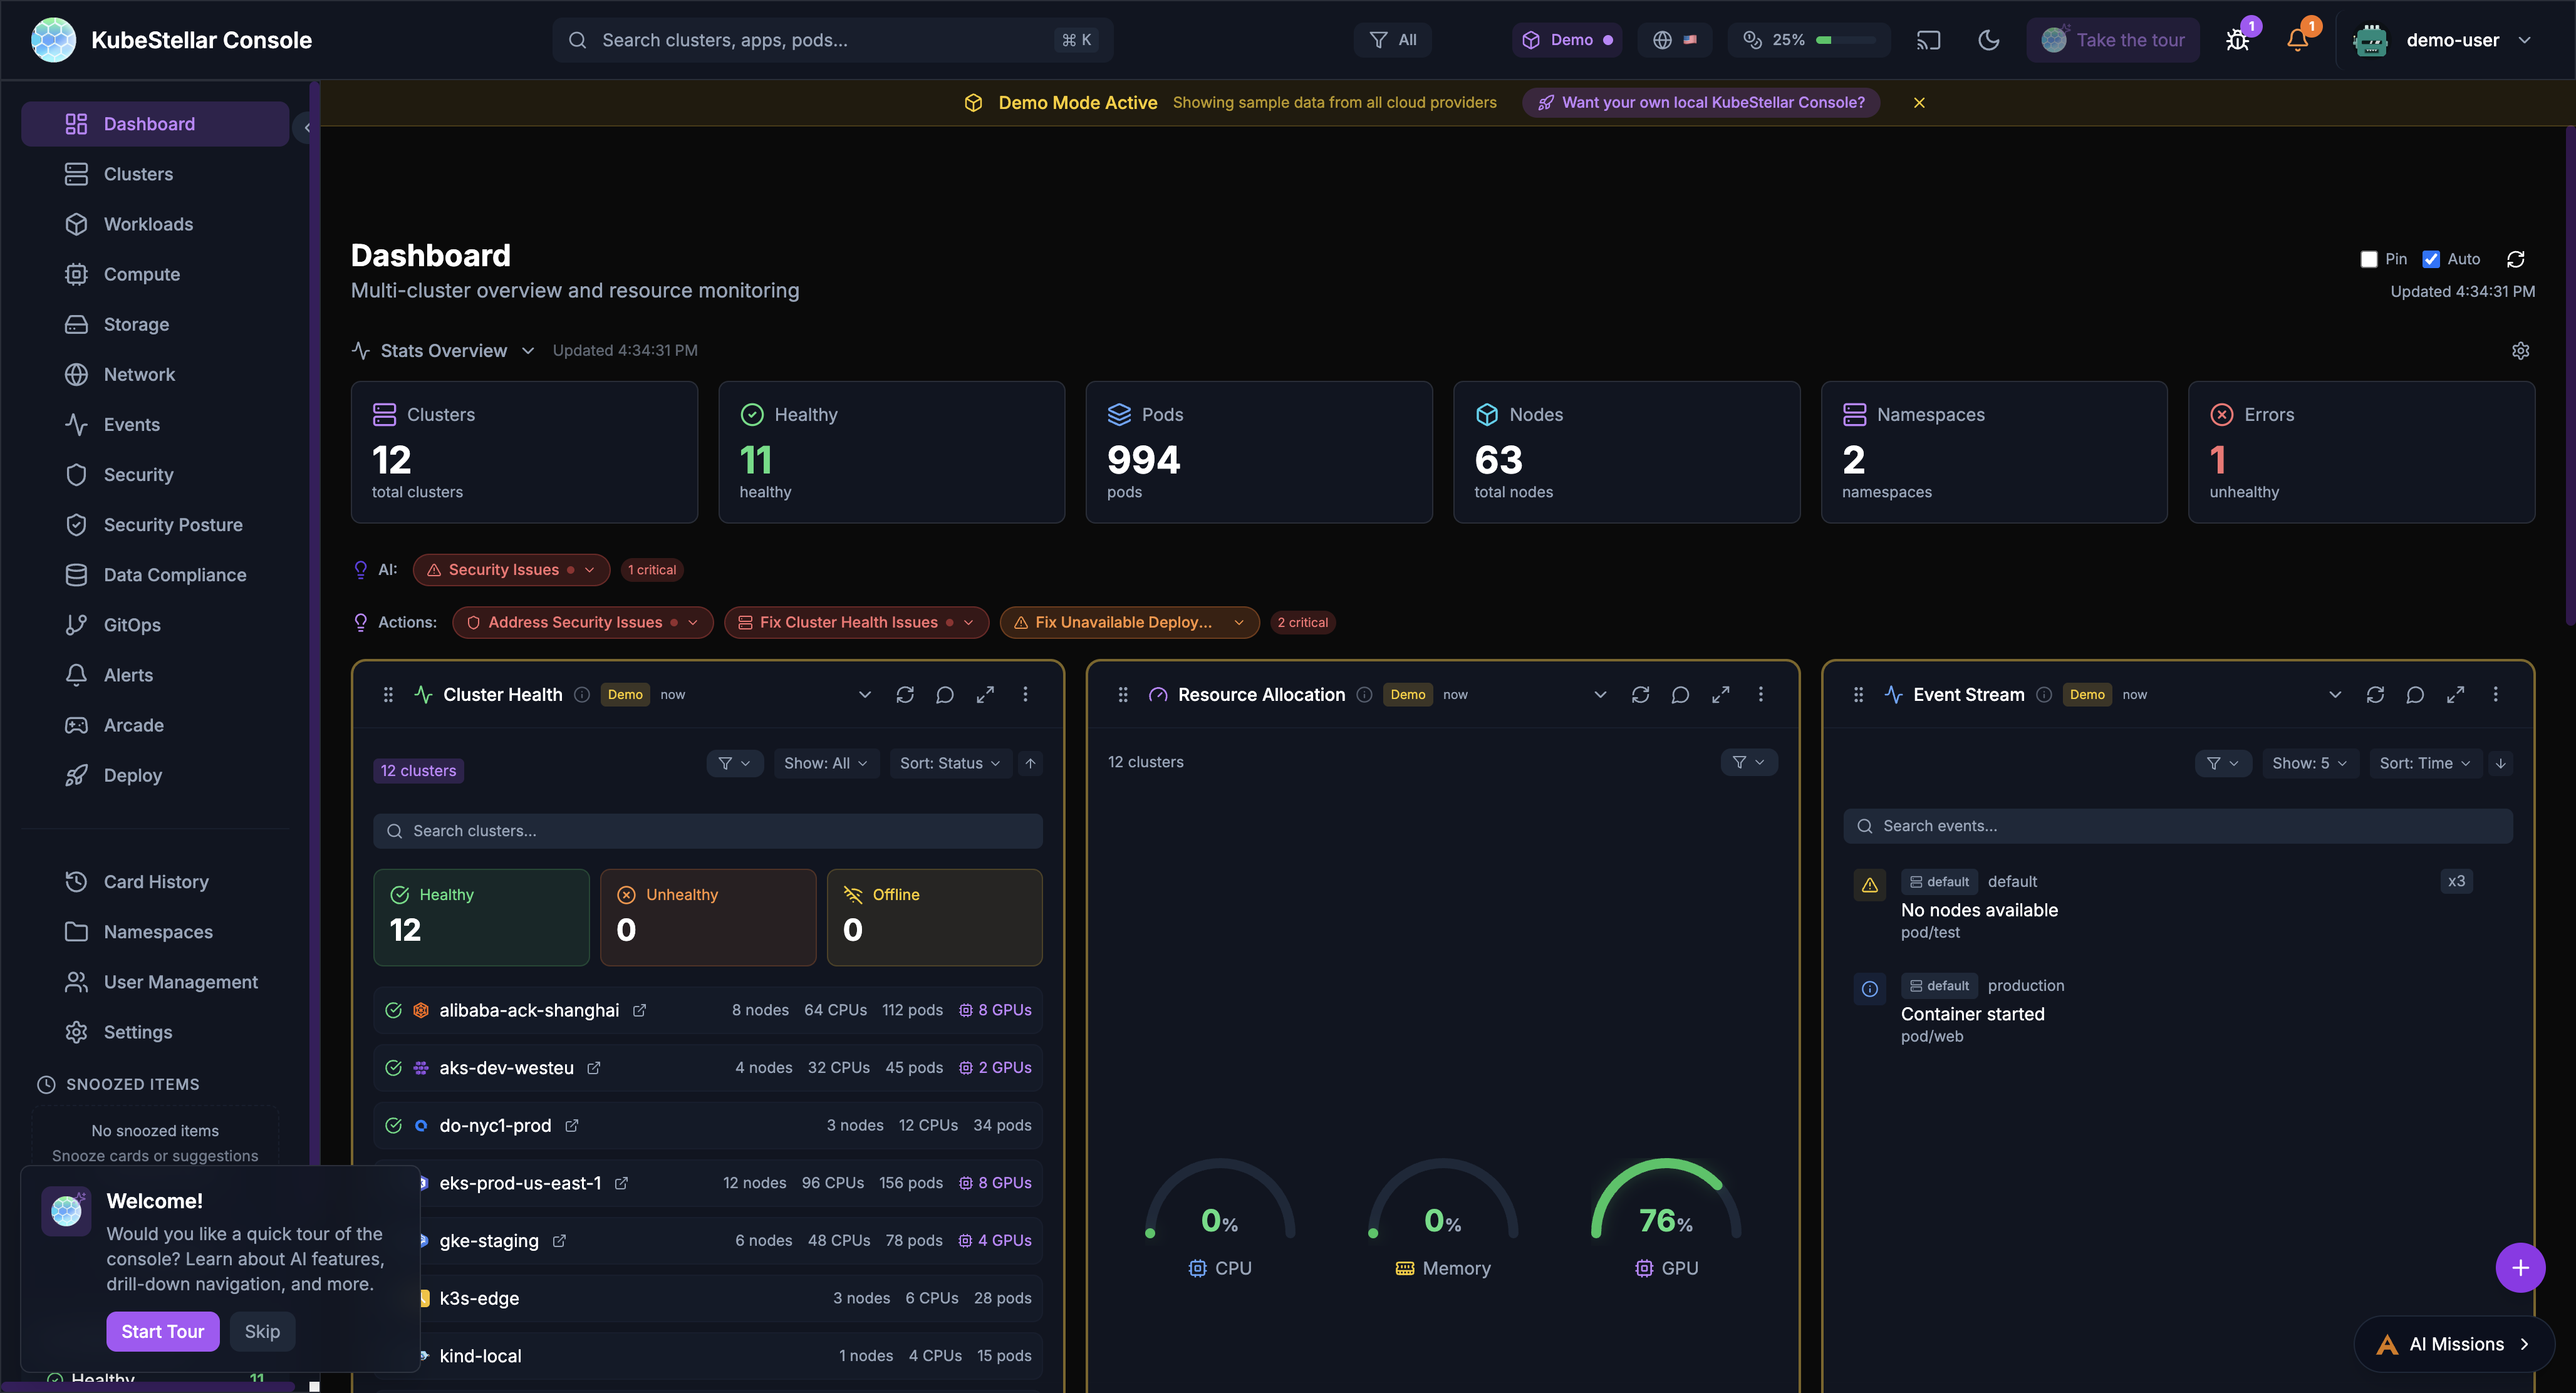
This is your home page. It shows:
- Overview of all your clusters
- Cards you’ve chosen to see
- Quick stats at the top
- AI suggestions for what to look at
The main dashboard learns what you care about and shows those things first.
Dedicated Dashboards (28)
Clusters Dashboard
Route: /clusters
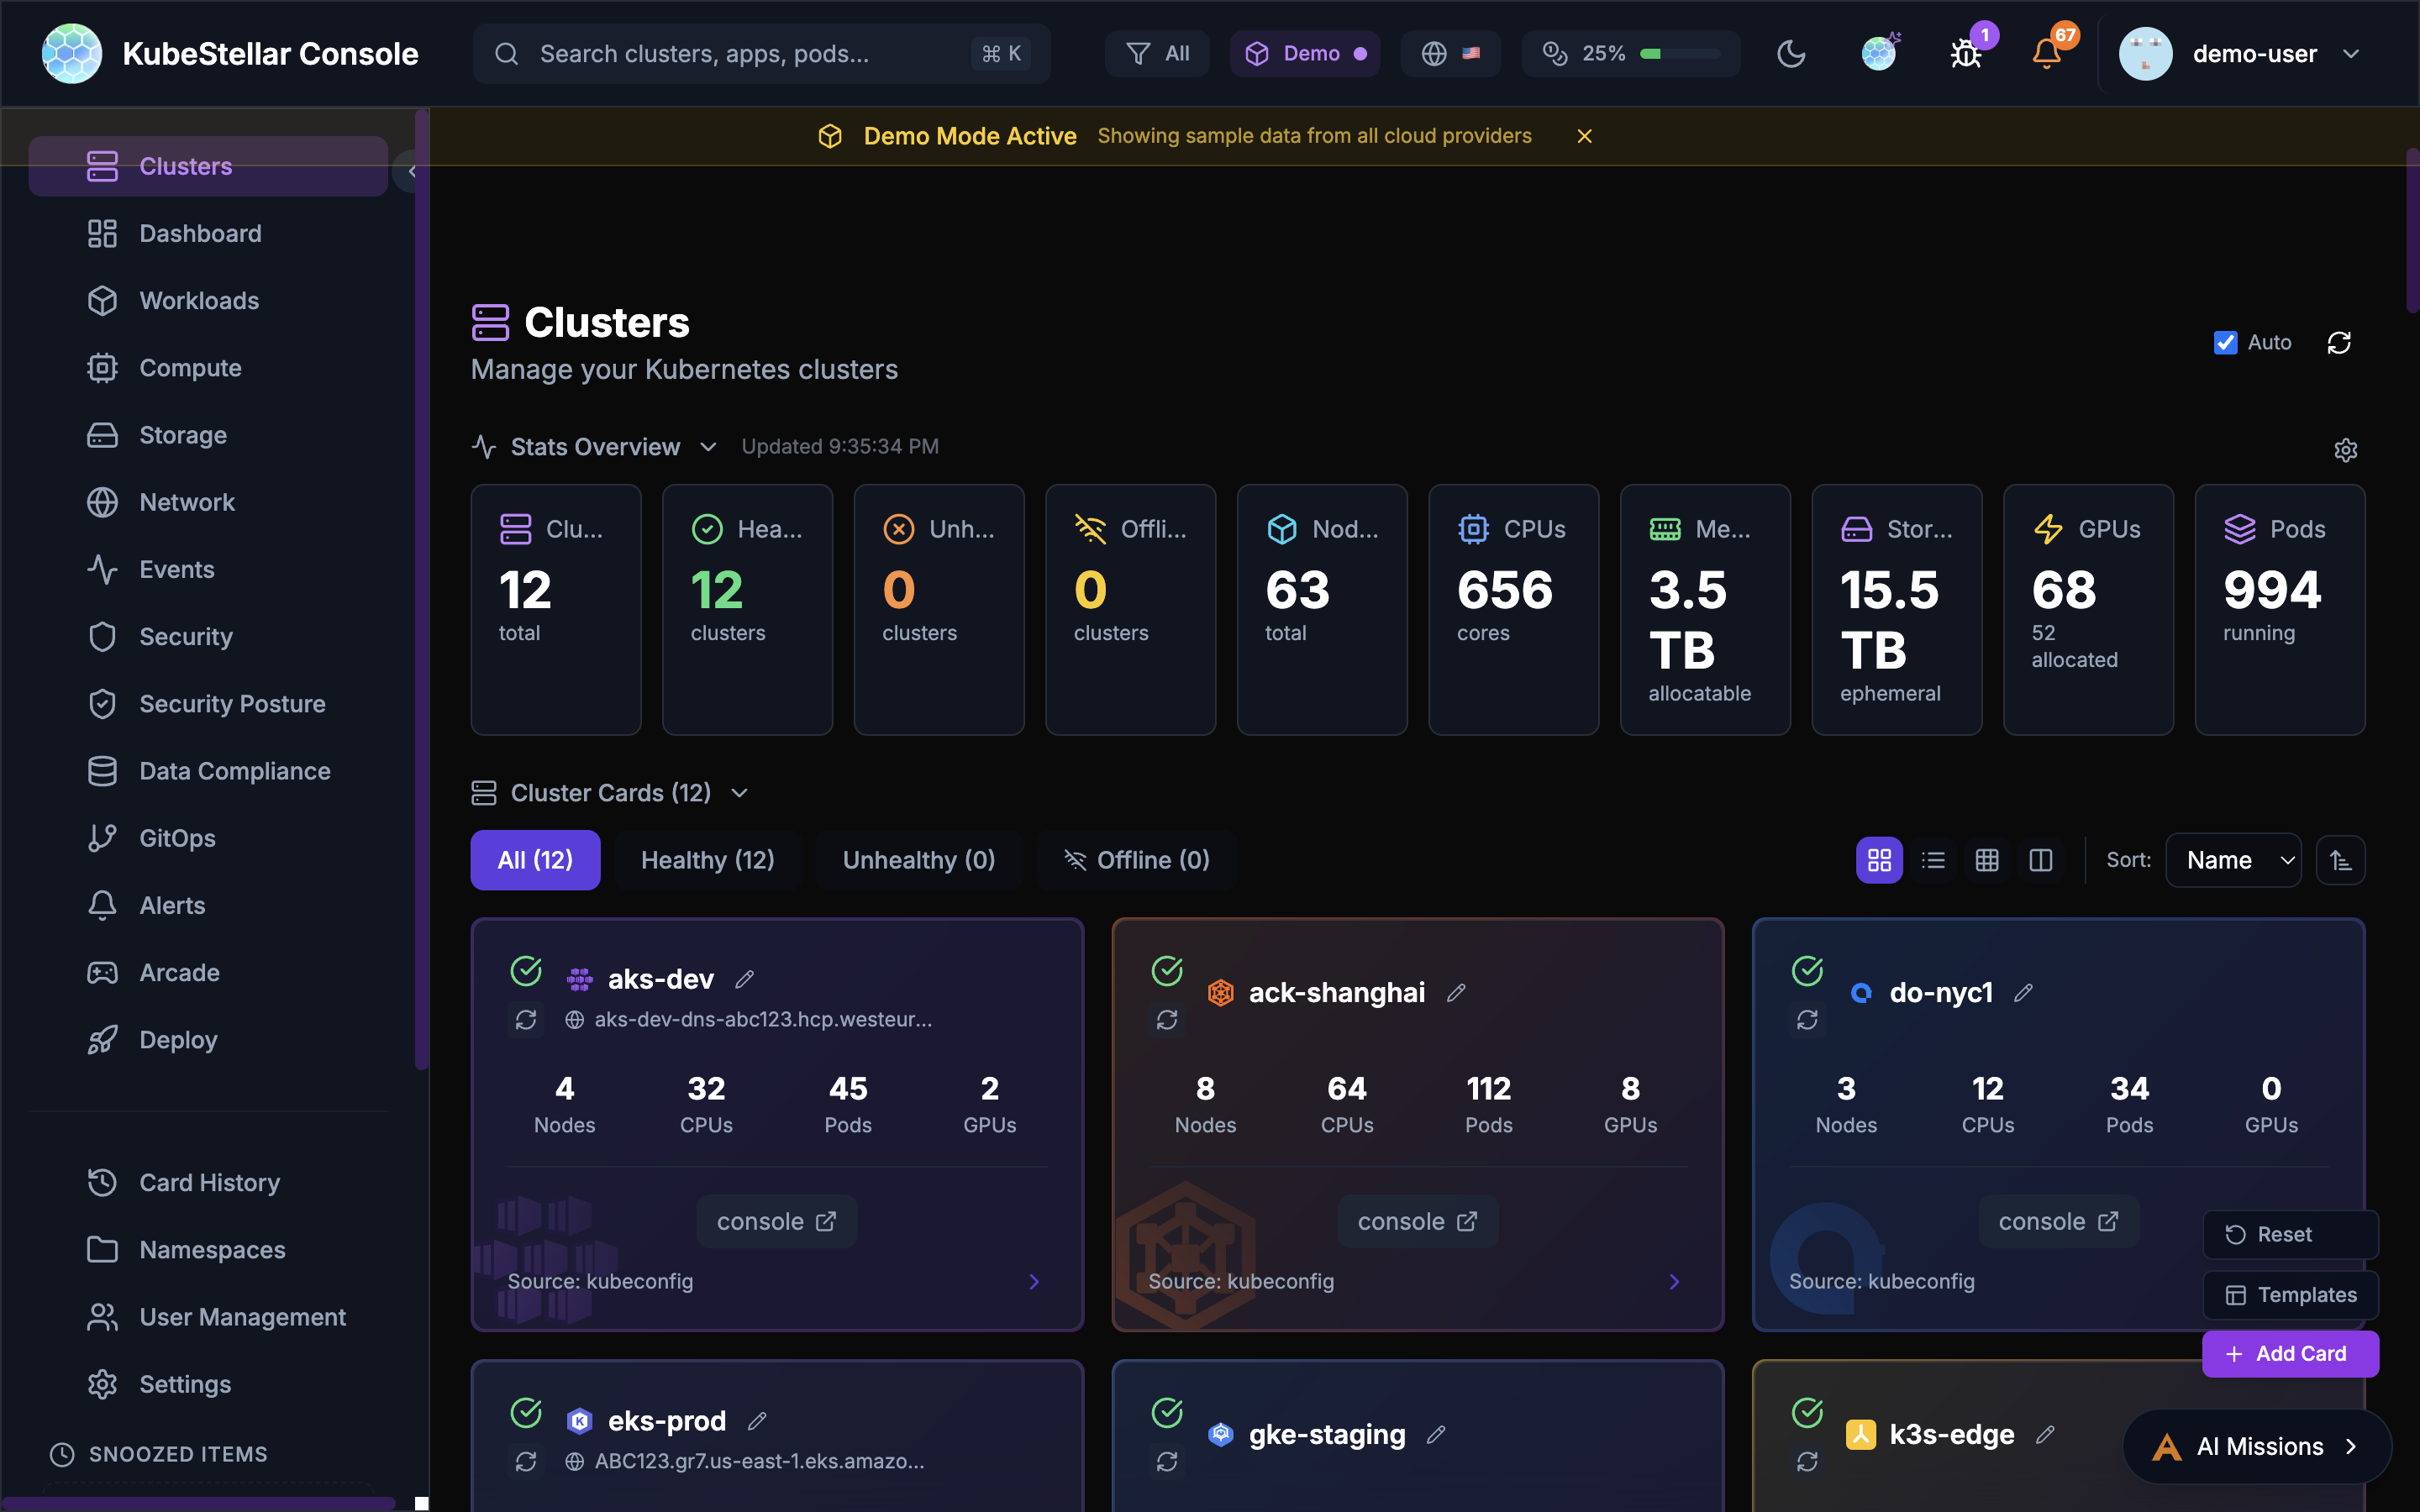
See all your Kubernetes clusters:
- Which clusters are healthy (green)
- Which clusters have problems (red)
- Which clusters are offline (gray)
- Quick links to each cluster’s native console
Best for: Checking if all your clusters are working
Workloads Dashboard
Route: /workloads
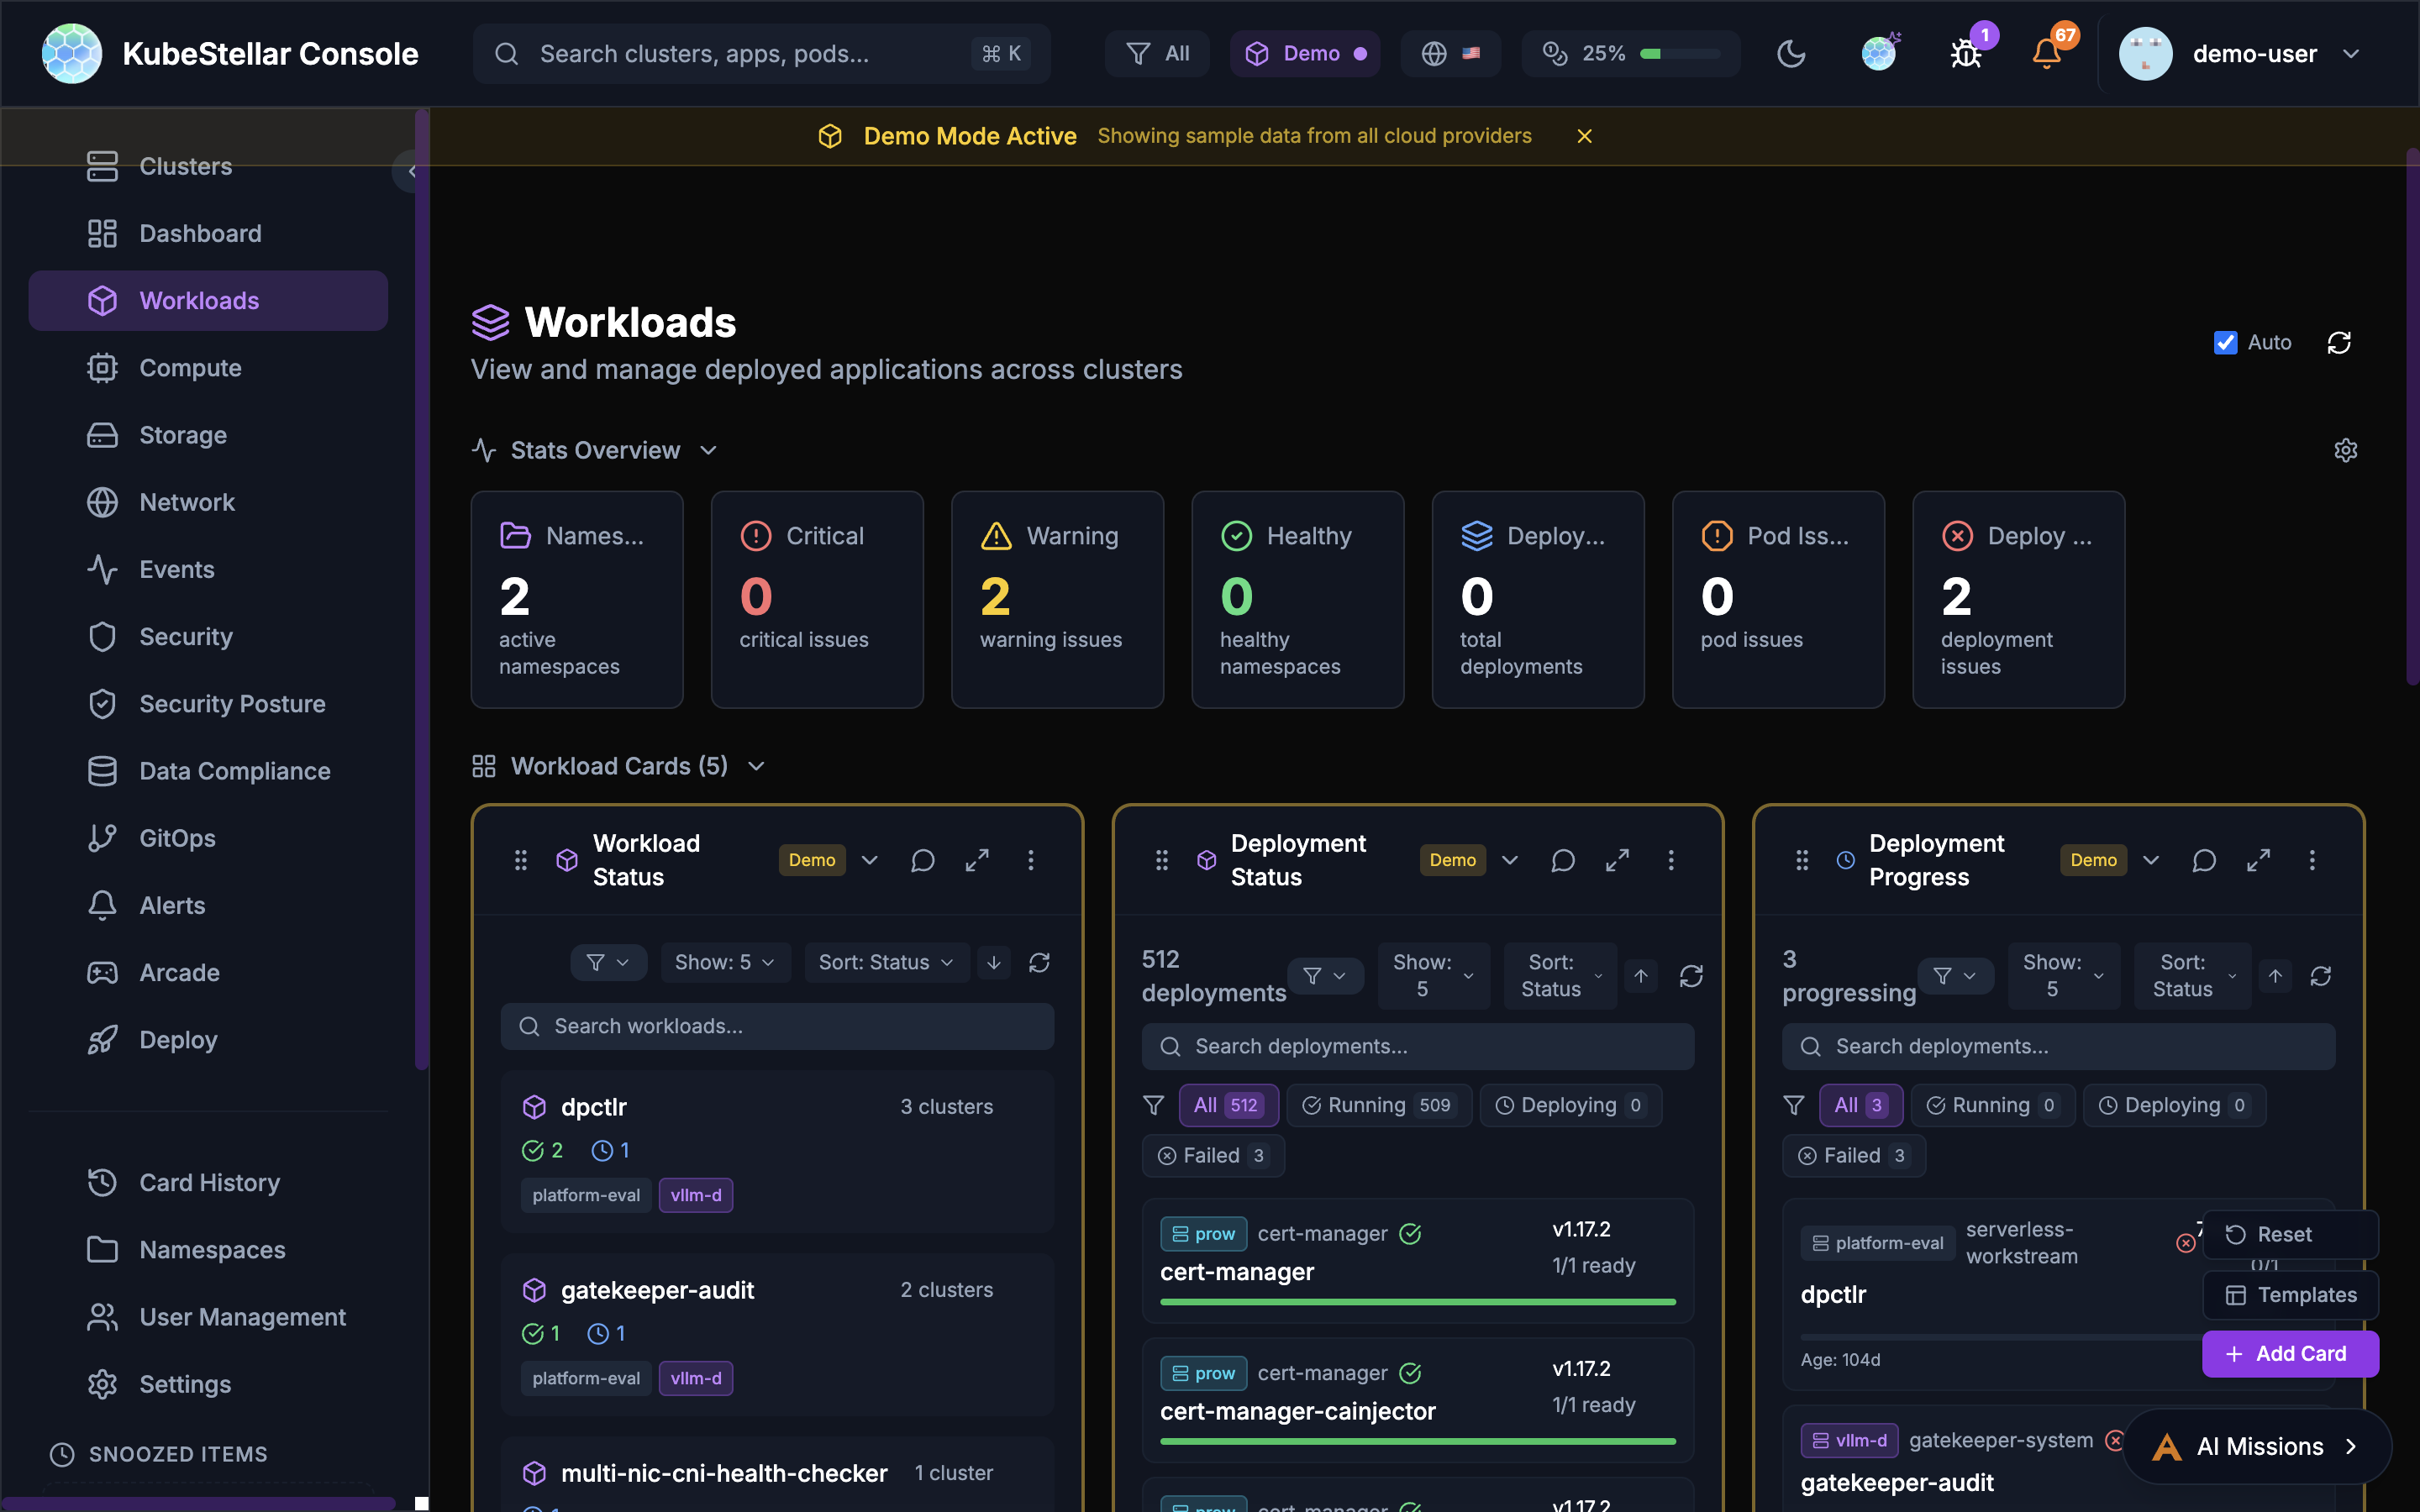
See all your running applications:
- Deployments and their status
- Pods that are having problems
- Which apps are healthy
Best for: Making sure your applications are running
Compute Dashboard
Route: /compute
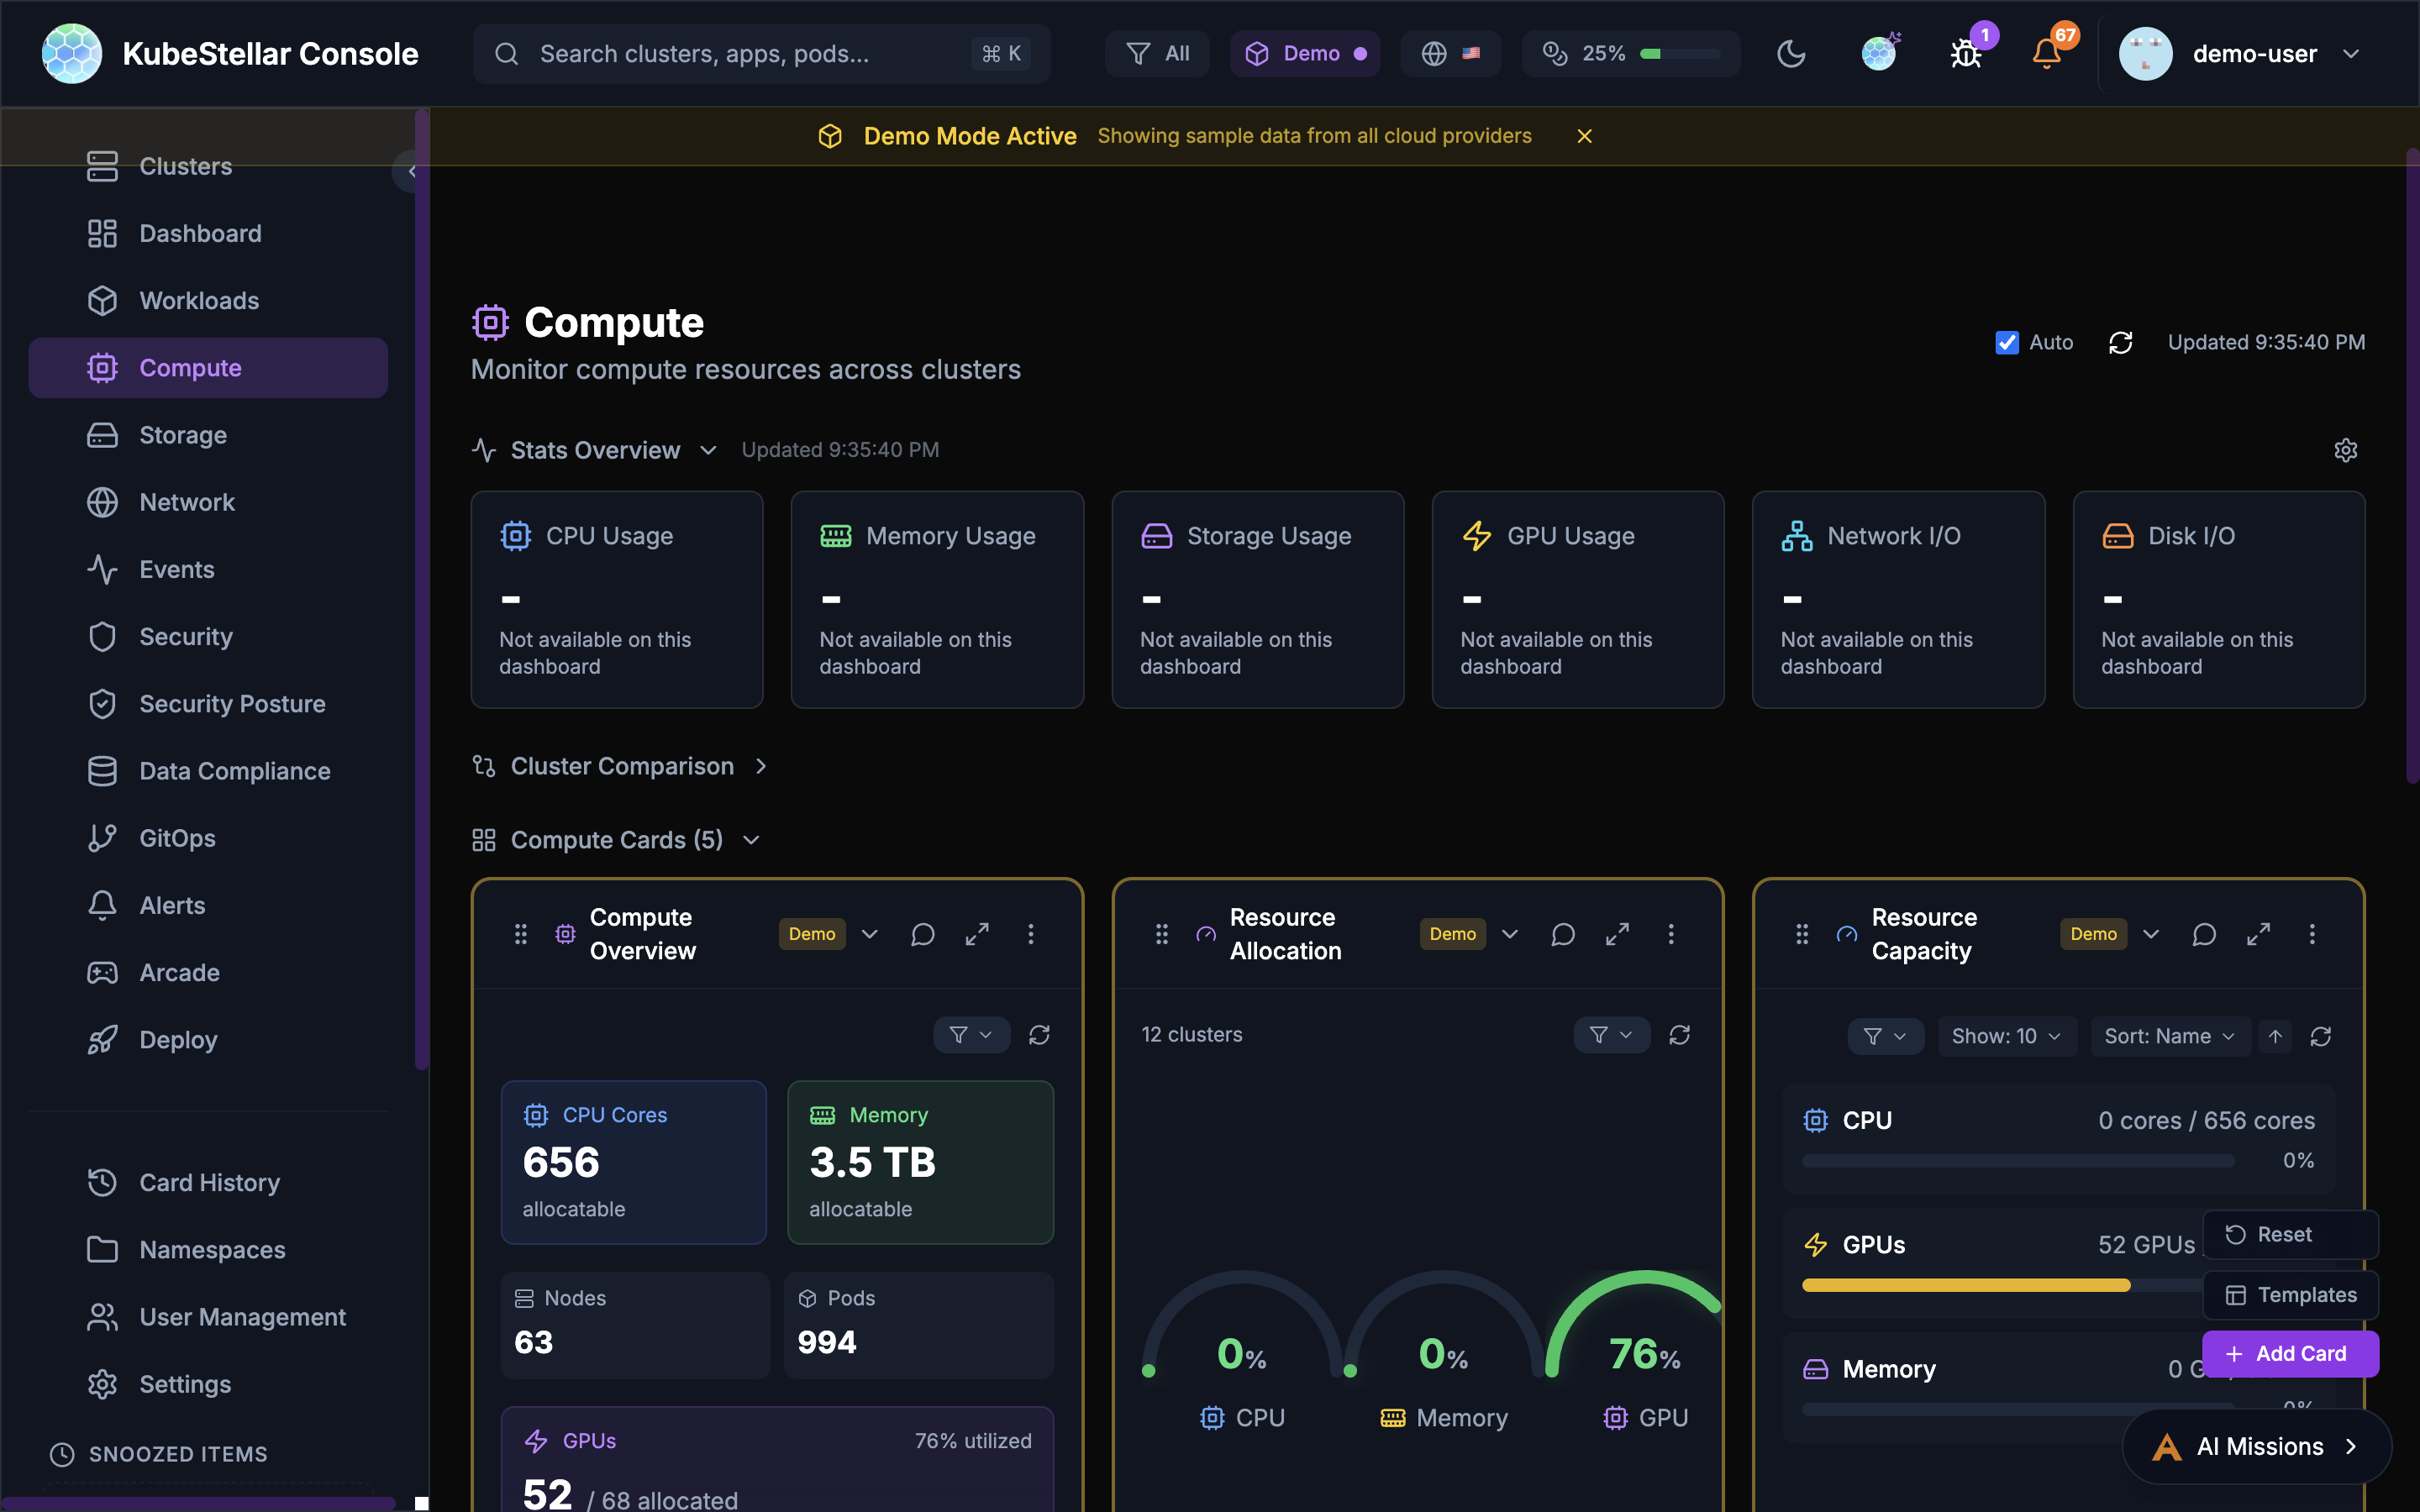
See your compute resources:
- How many CPUs you have
- How much memory is available
- GPU usage (important for AI workloads!)
- Top pods using resources
Best for: Checking if you have enough resources
Storage Dashboard
Route: /storage
See your storage:
- Persistent Volume Claims (PVCs)
- Storage classes
- Which volumes are bound or pending
Best for: Managing disk space for your apps
Network Dashboard
Route: /network
See your networking:
- Services and their types
- LoadBalancers
- Ingresses
- Endpoints
Best for: Understanding how traffic flows
Events Dashboard
Route: /events
See what’s happening:
- Recent events from all clusters
- Warnings that need attention
- Normal events
- Filter by time or type
Best for: Troubleshooting when something goes wrong
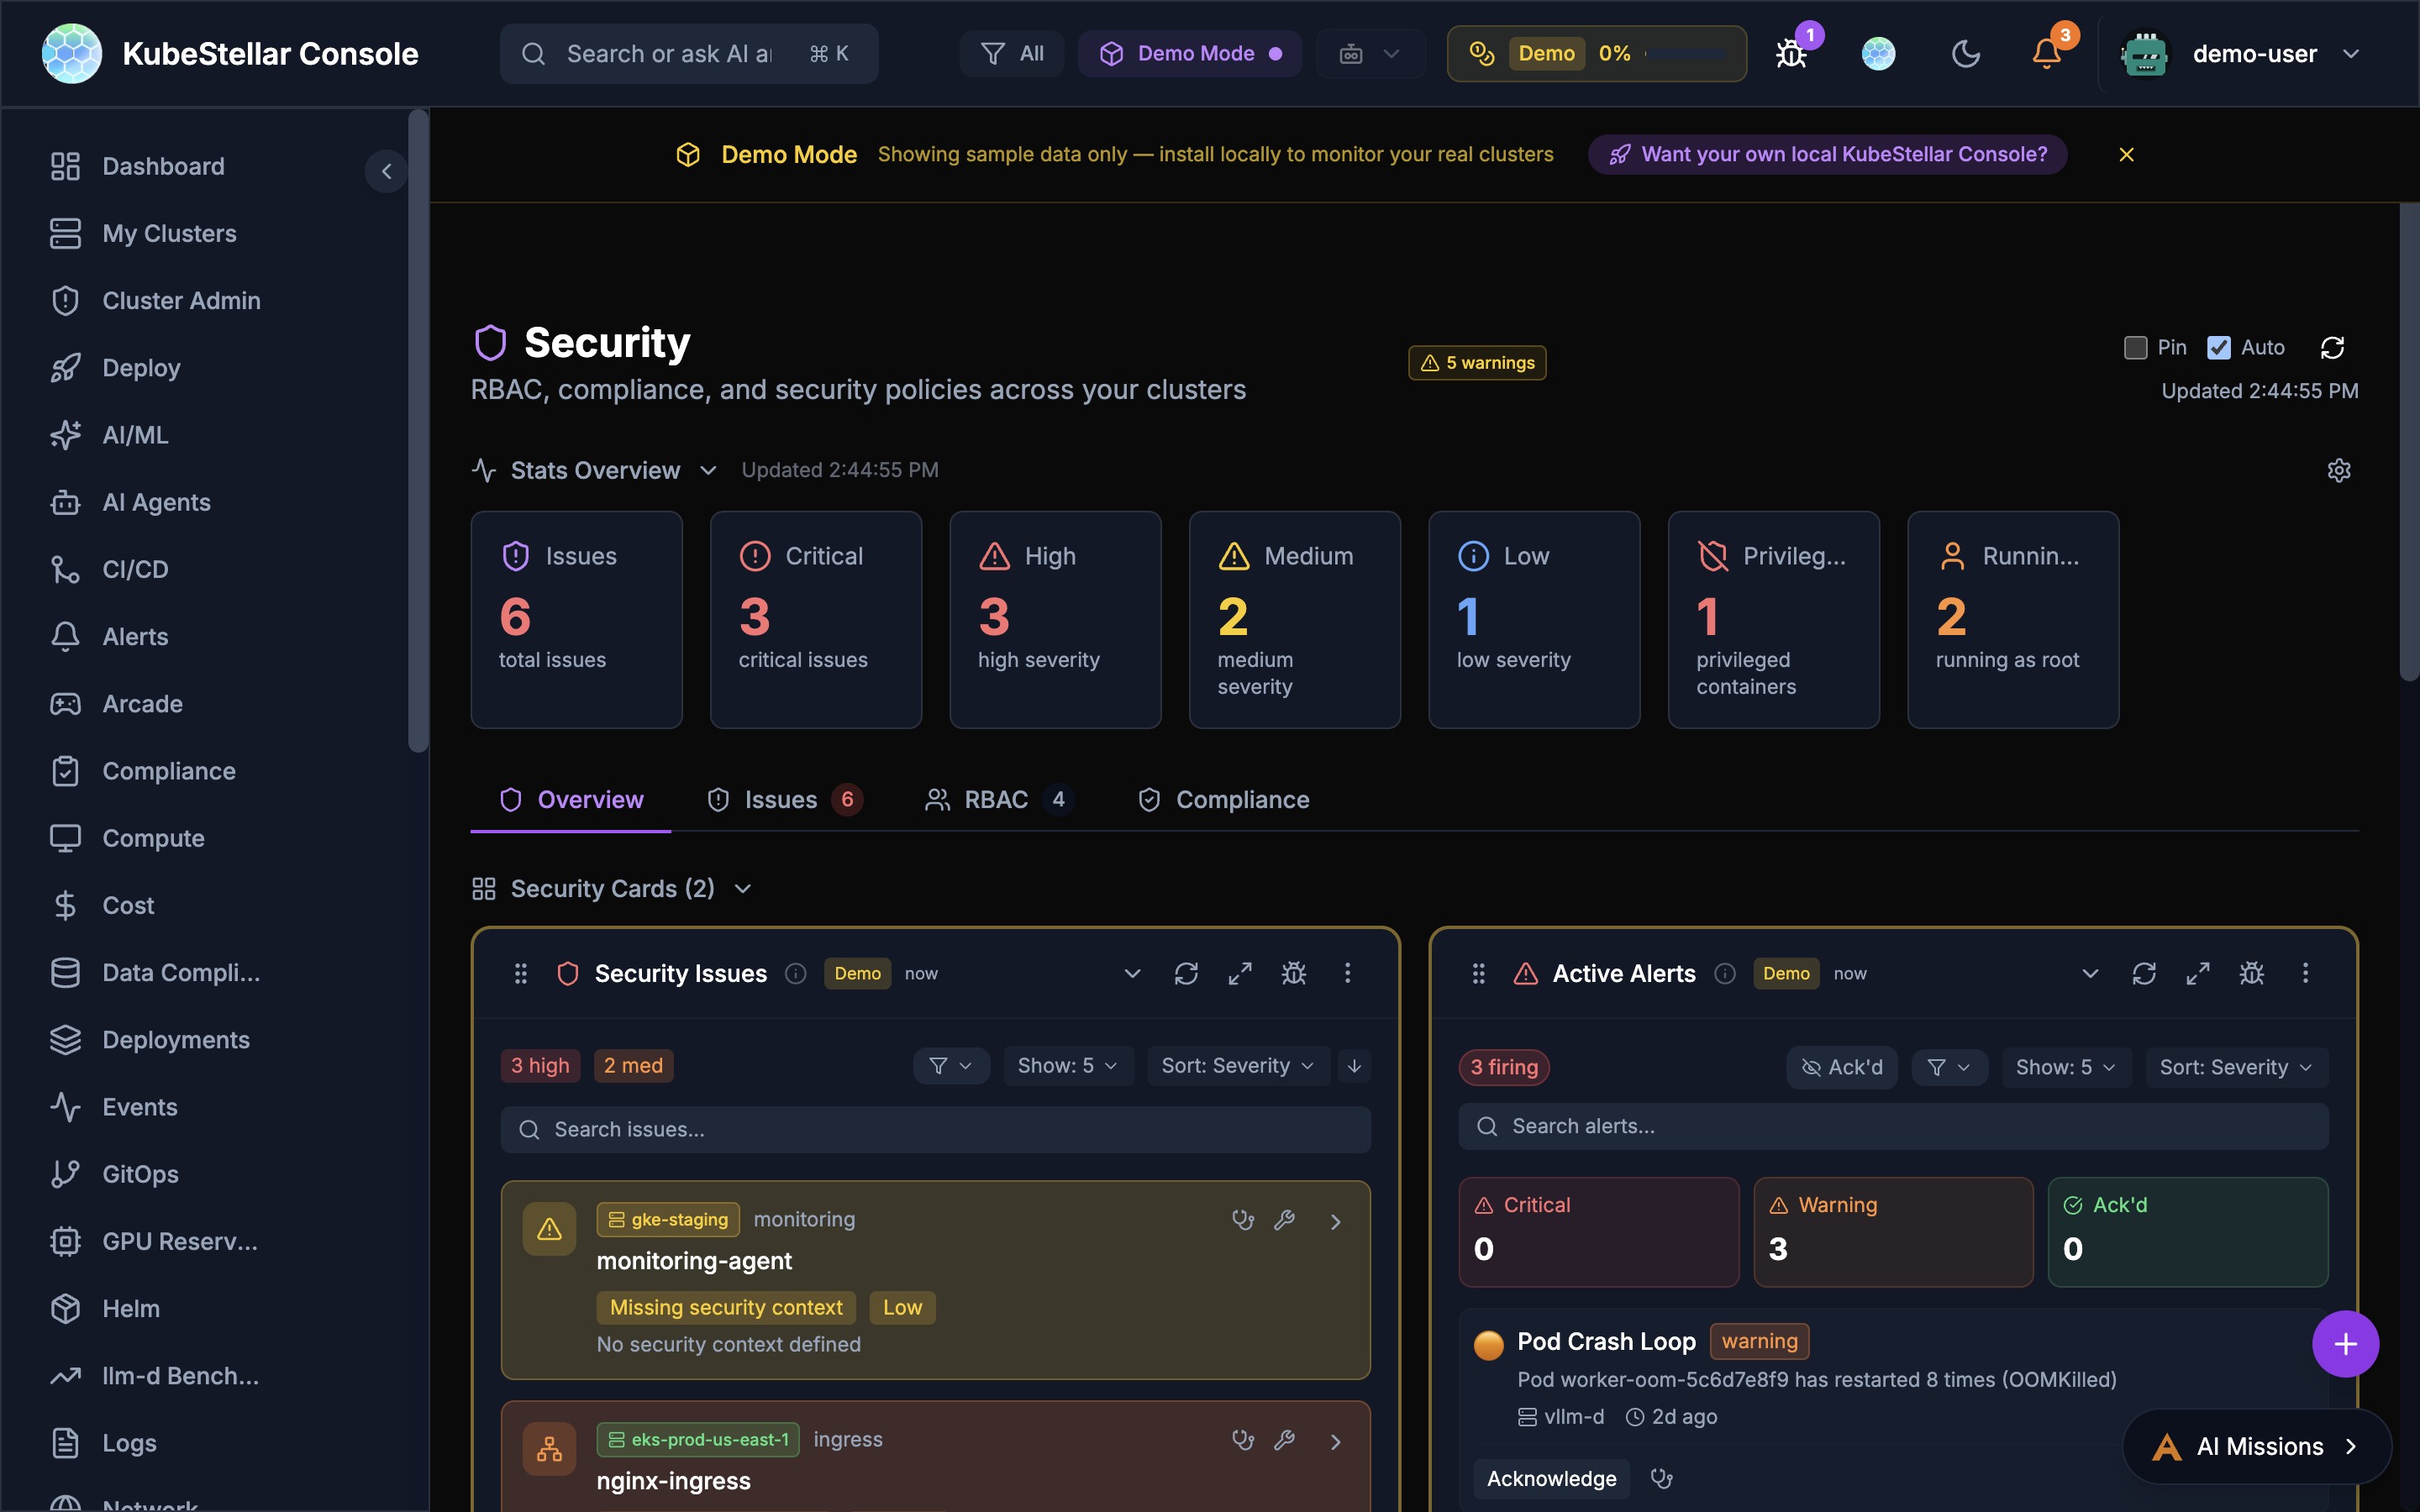
Security Dashboard
Route: /security
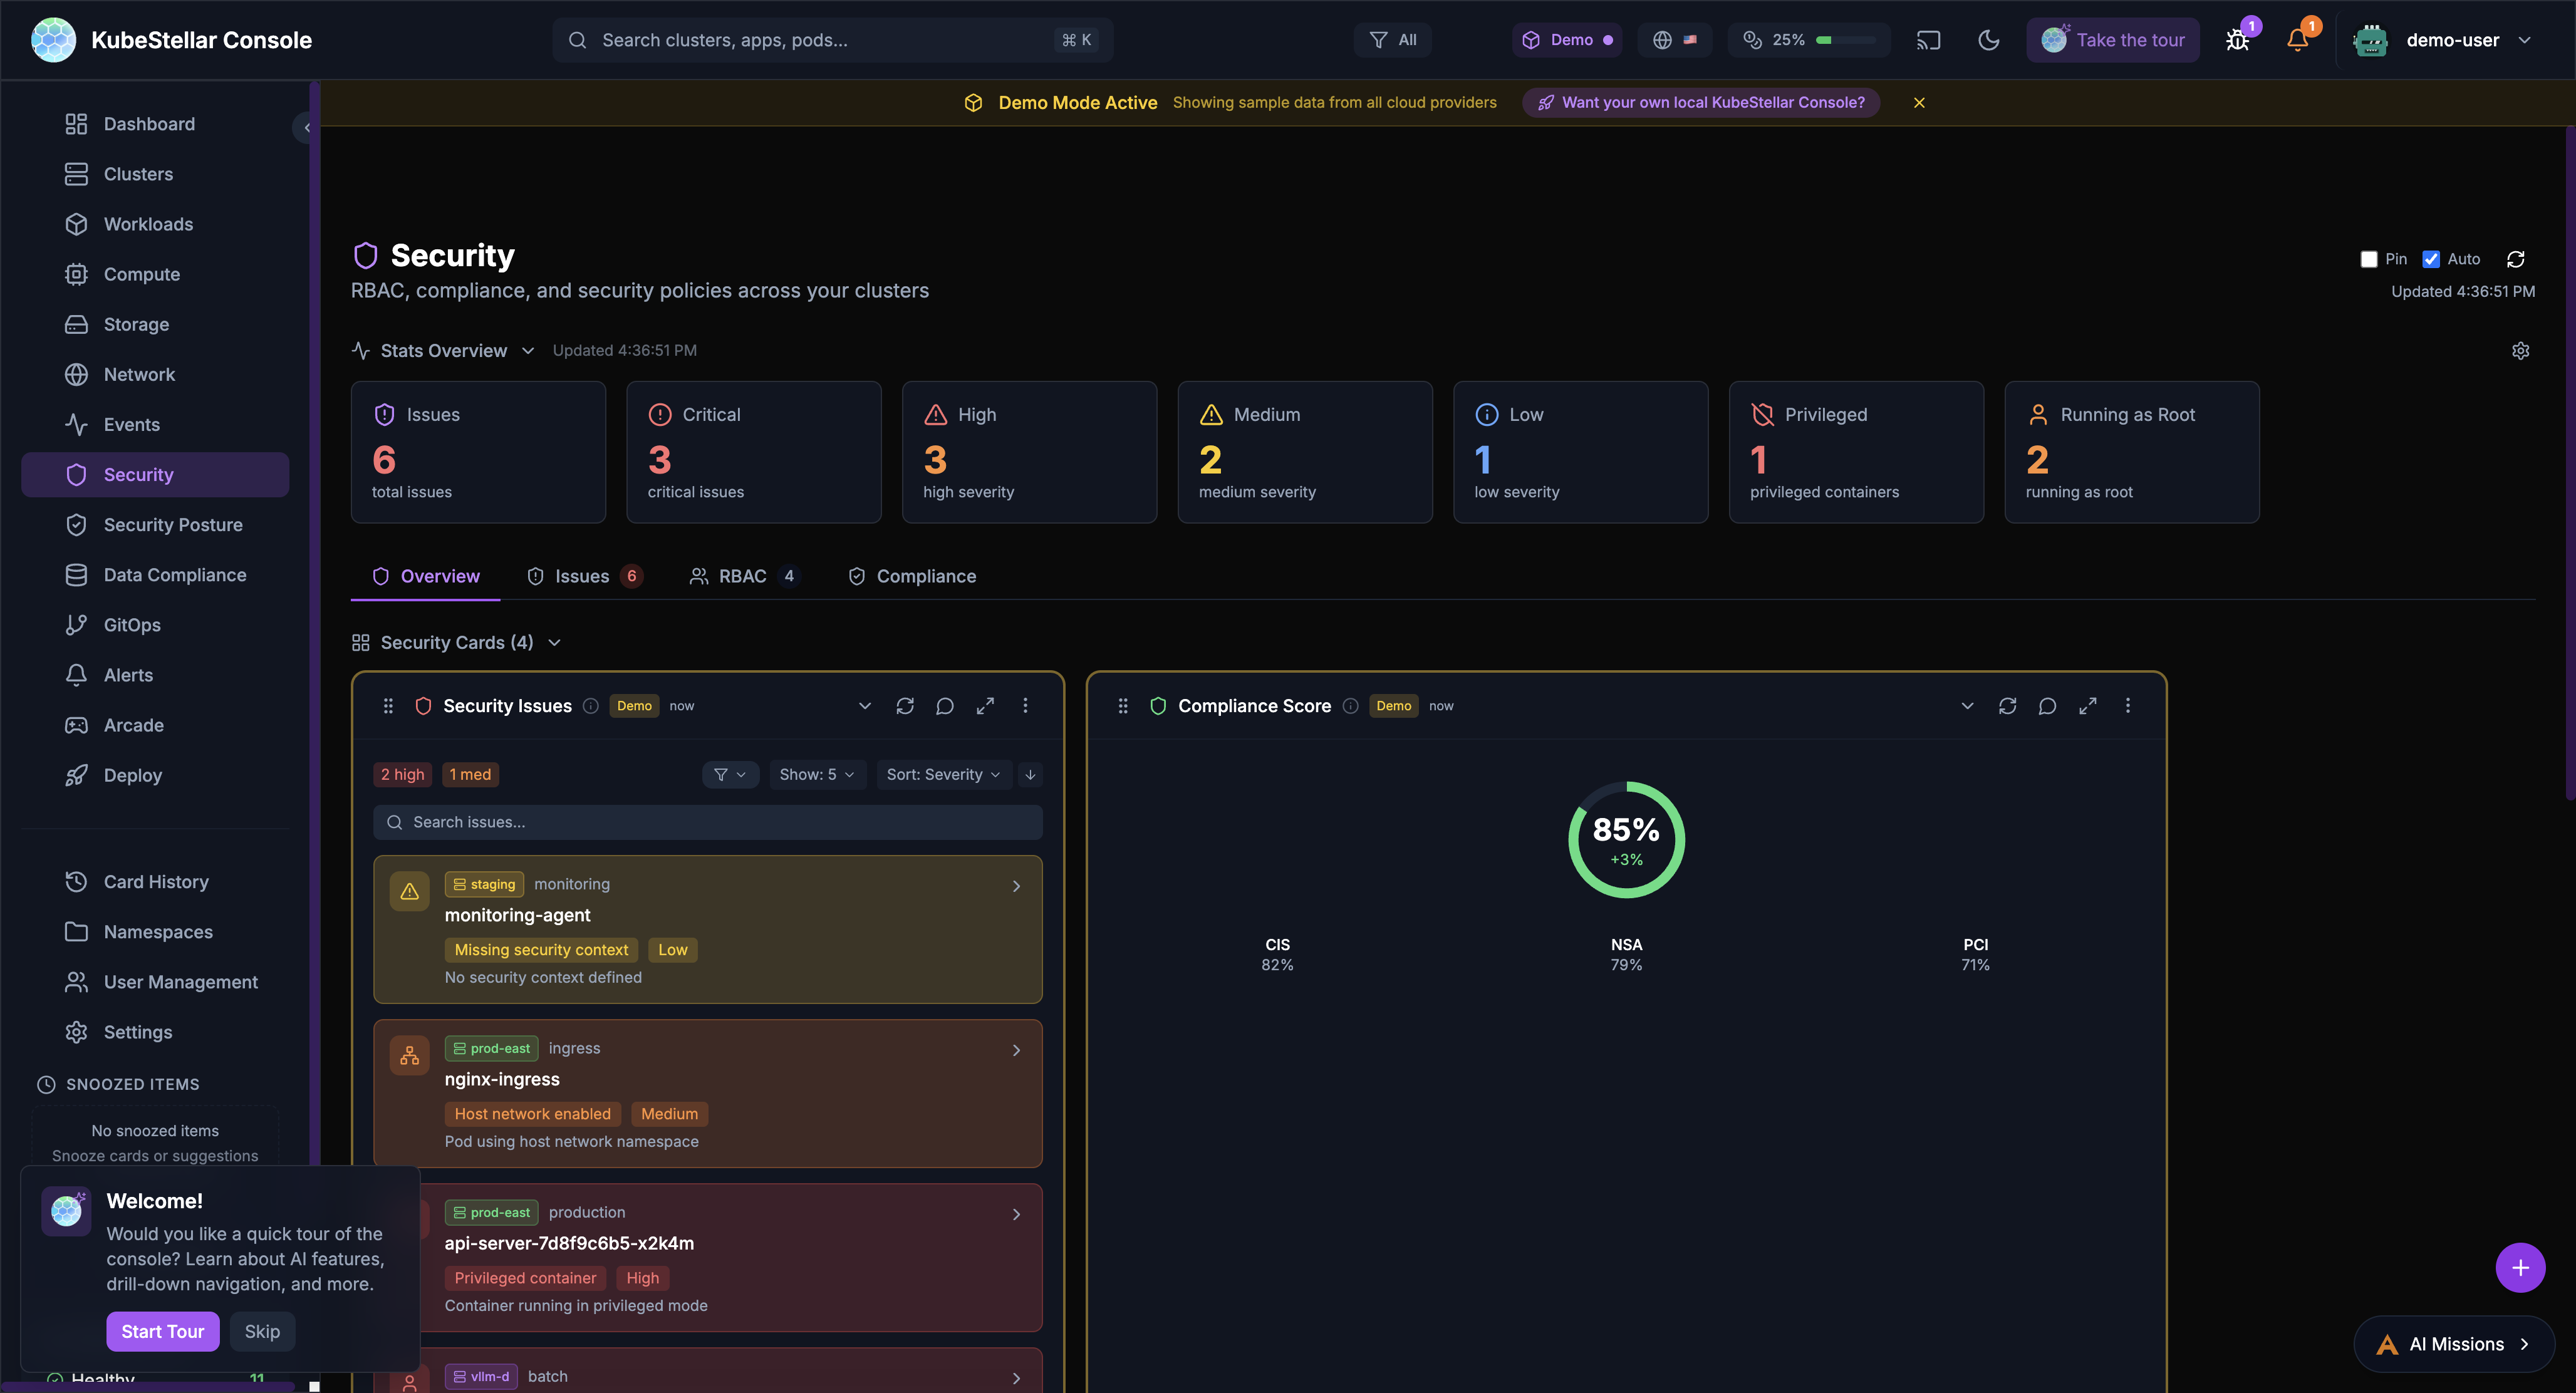
Find security issues:
- Containers running as root
- Privileged containers
- Missing security contexts
- Critical and high severity issues
Best for: Keeping your clusters secure
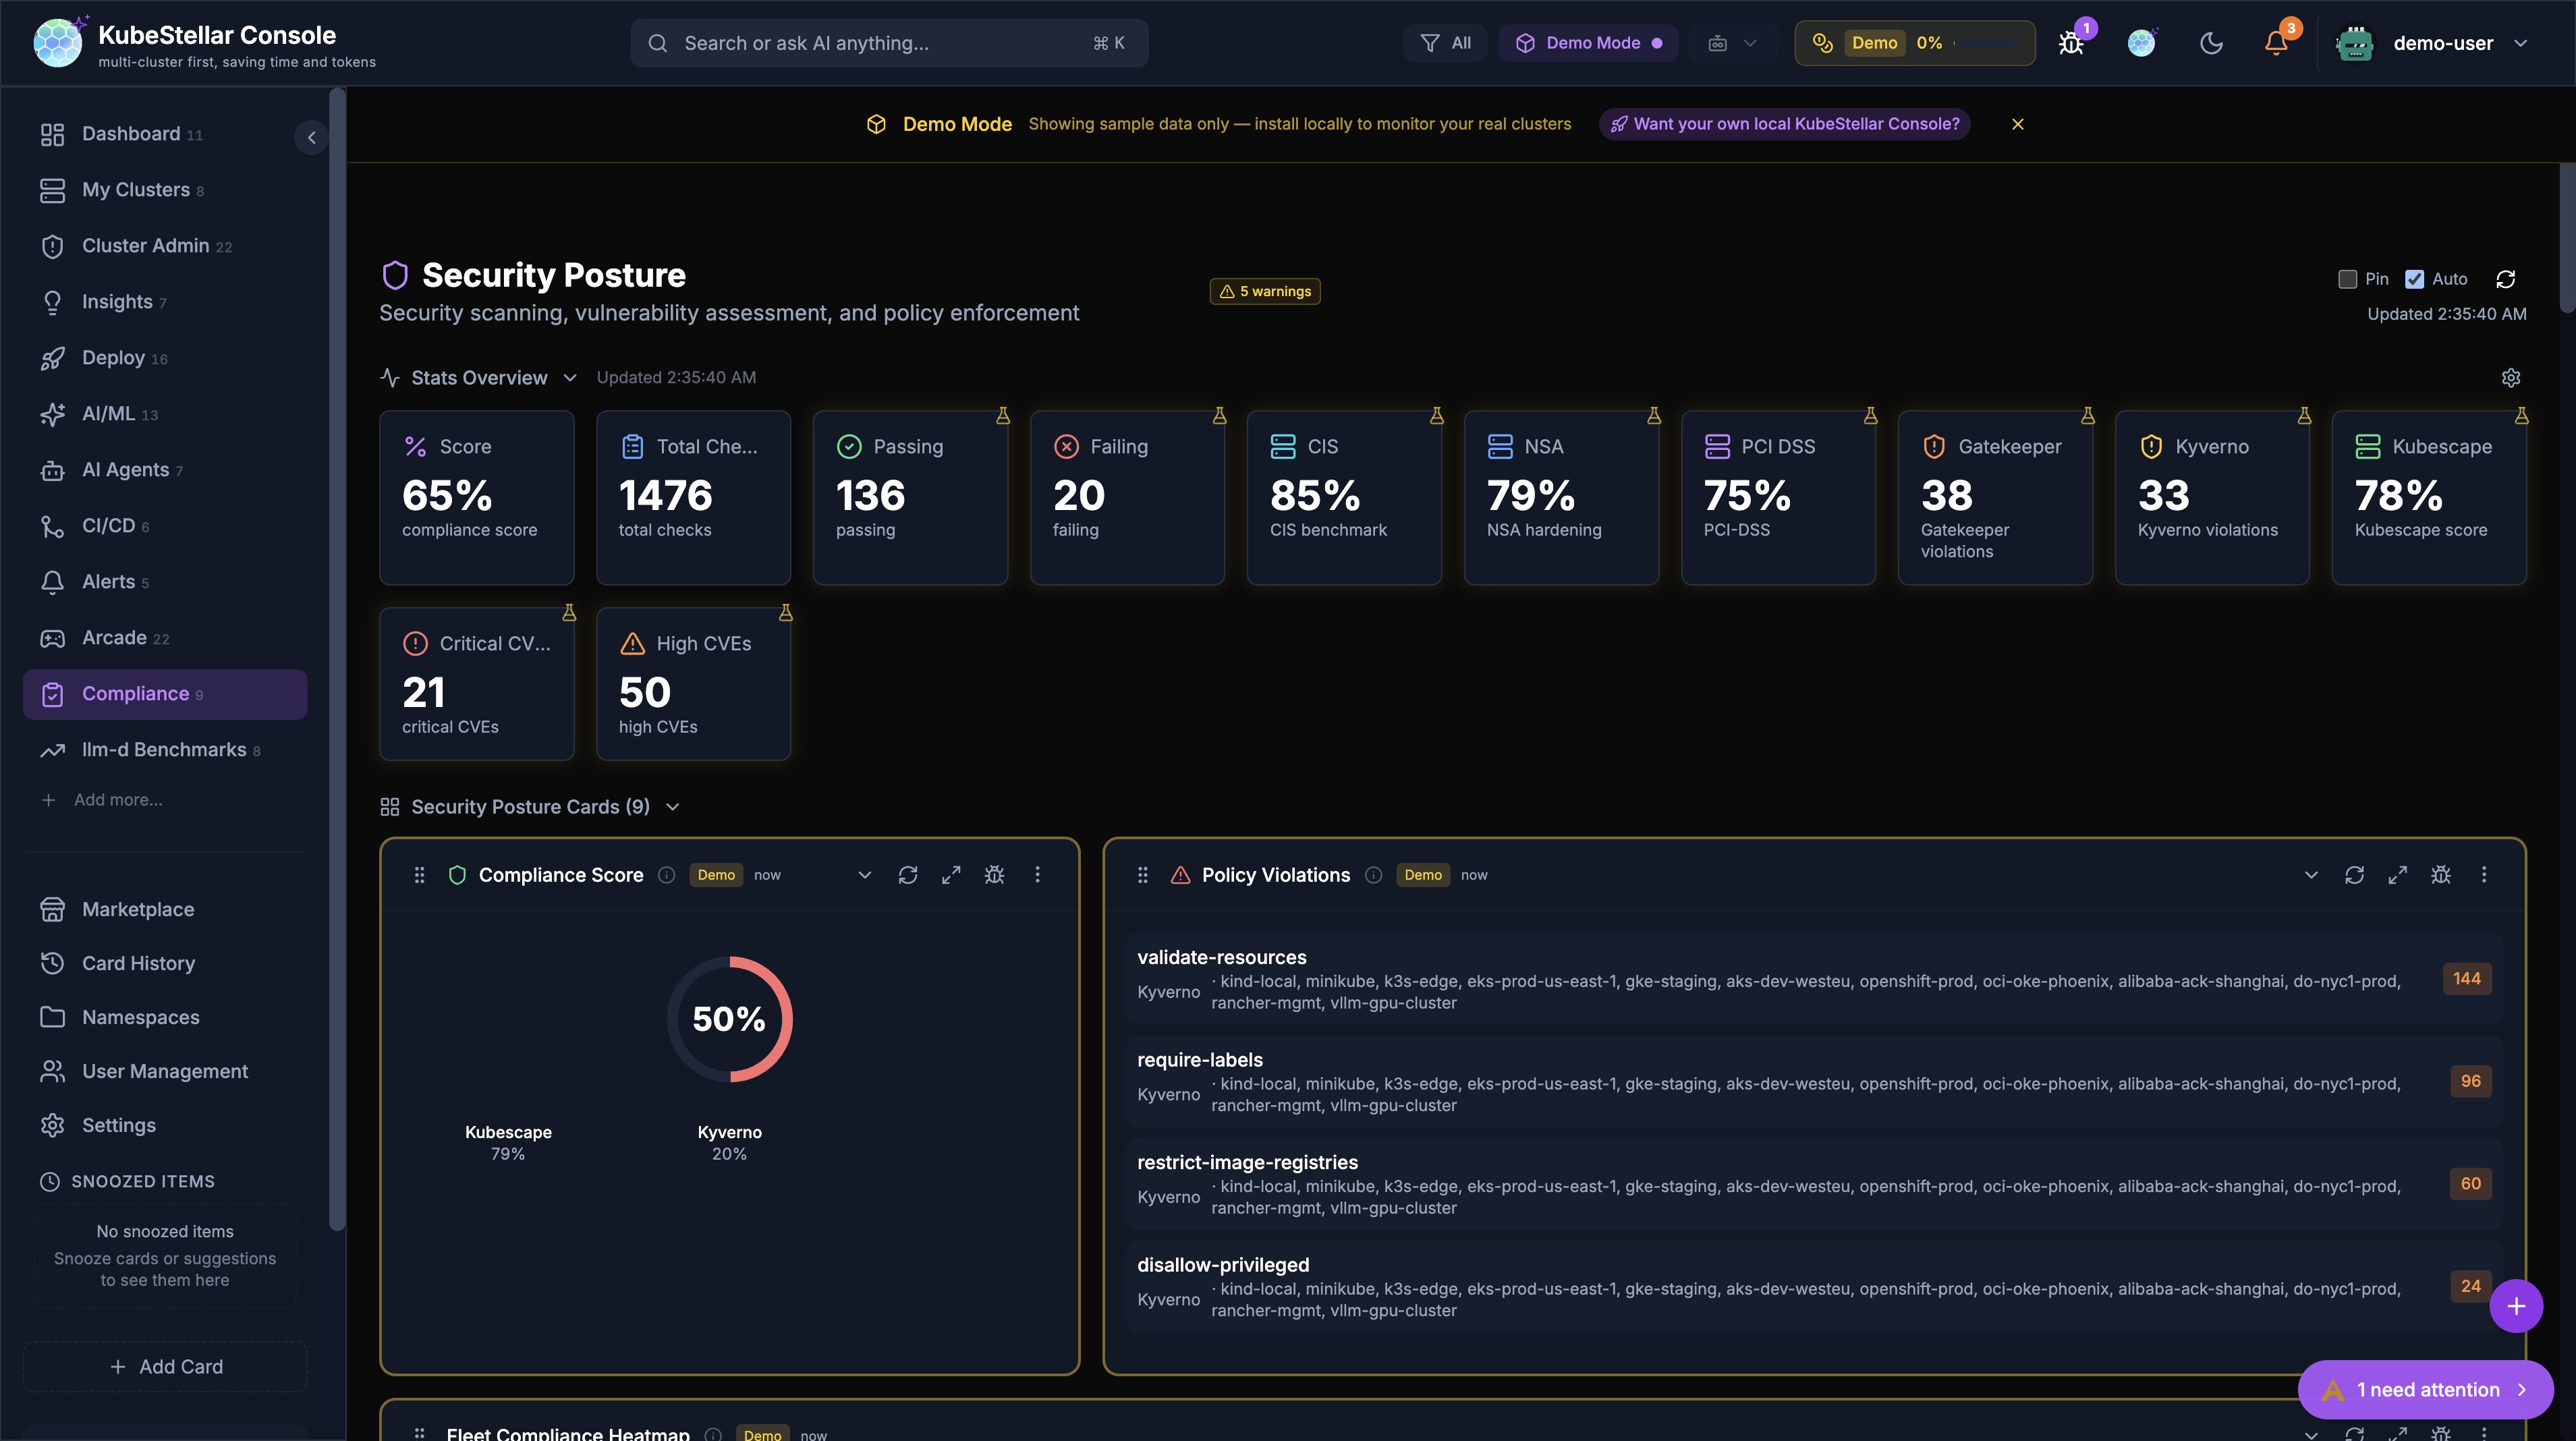
Security Posture Dashboard
Route: /security-posture
Comprehensive security scanning, vulnerability assessment, and policy enforcement:
- Compliance Score: Overall security score across all clusters (e.g., 78%)
- Total Checks: Count of all security checks performed (405+)
- Benchmark Scores: CIS, NSA, PCI-DSS benchmark compliance percentages
- Policy Violations: Real-time violation tracking with severity breakdown
- OPA Policies: Create, manage, and enforce OPA Gatekeeper policies with AI-assisted policy generation
- Kyverno Policies: Install and manage Kyverno for Kubernetes-native policy management
- Vulnerability Scanning: Critical and high CVE tracking across container images
- Kubescape Integration: Automated security posture scanning with 80%+ benchmark scores
New in March 2026:
- AI-driven Create Policy modal for natural language policy generation
- Parallel cluster checks for faster policy evaluation across many clusters
- Two-phase loading: policy metadata loads instantly, violations populate in background
Best for: Enterprise security compliance and policy enforcement
GitOps Dashboard
Route: /gitops
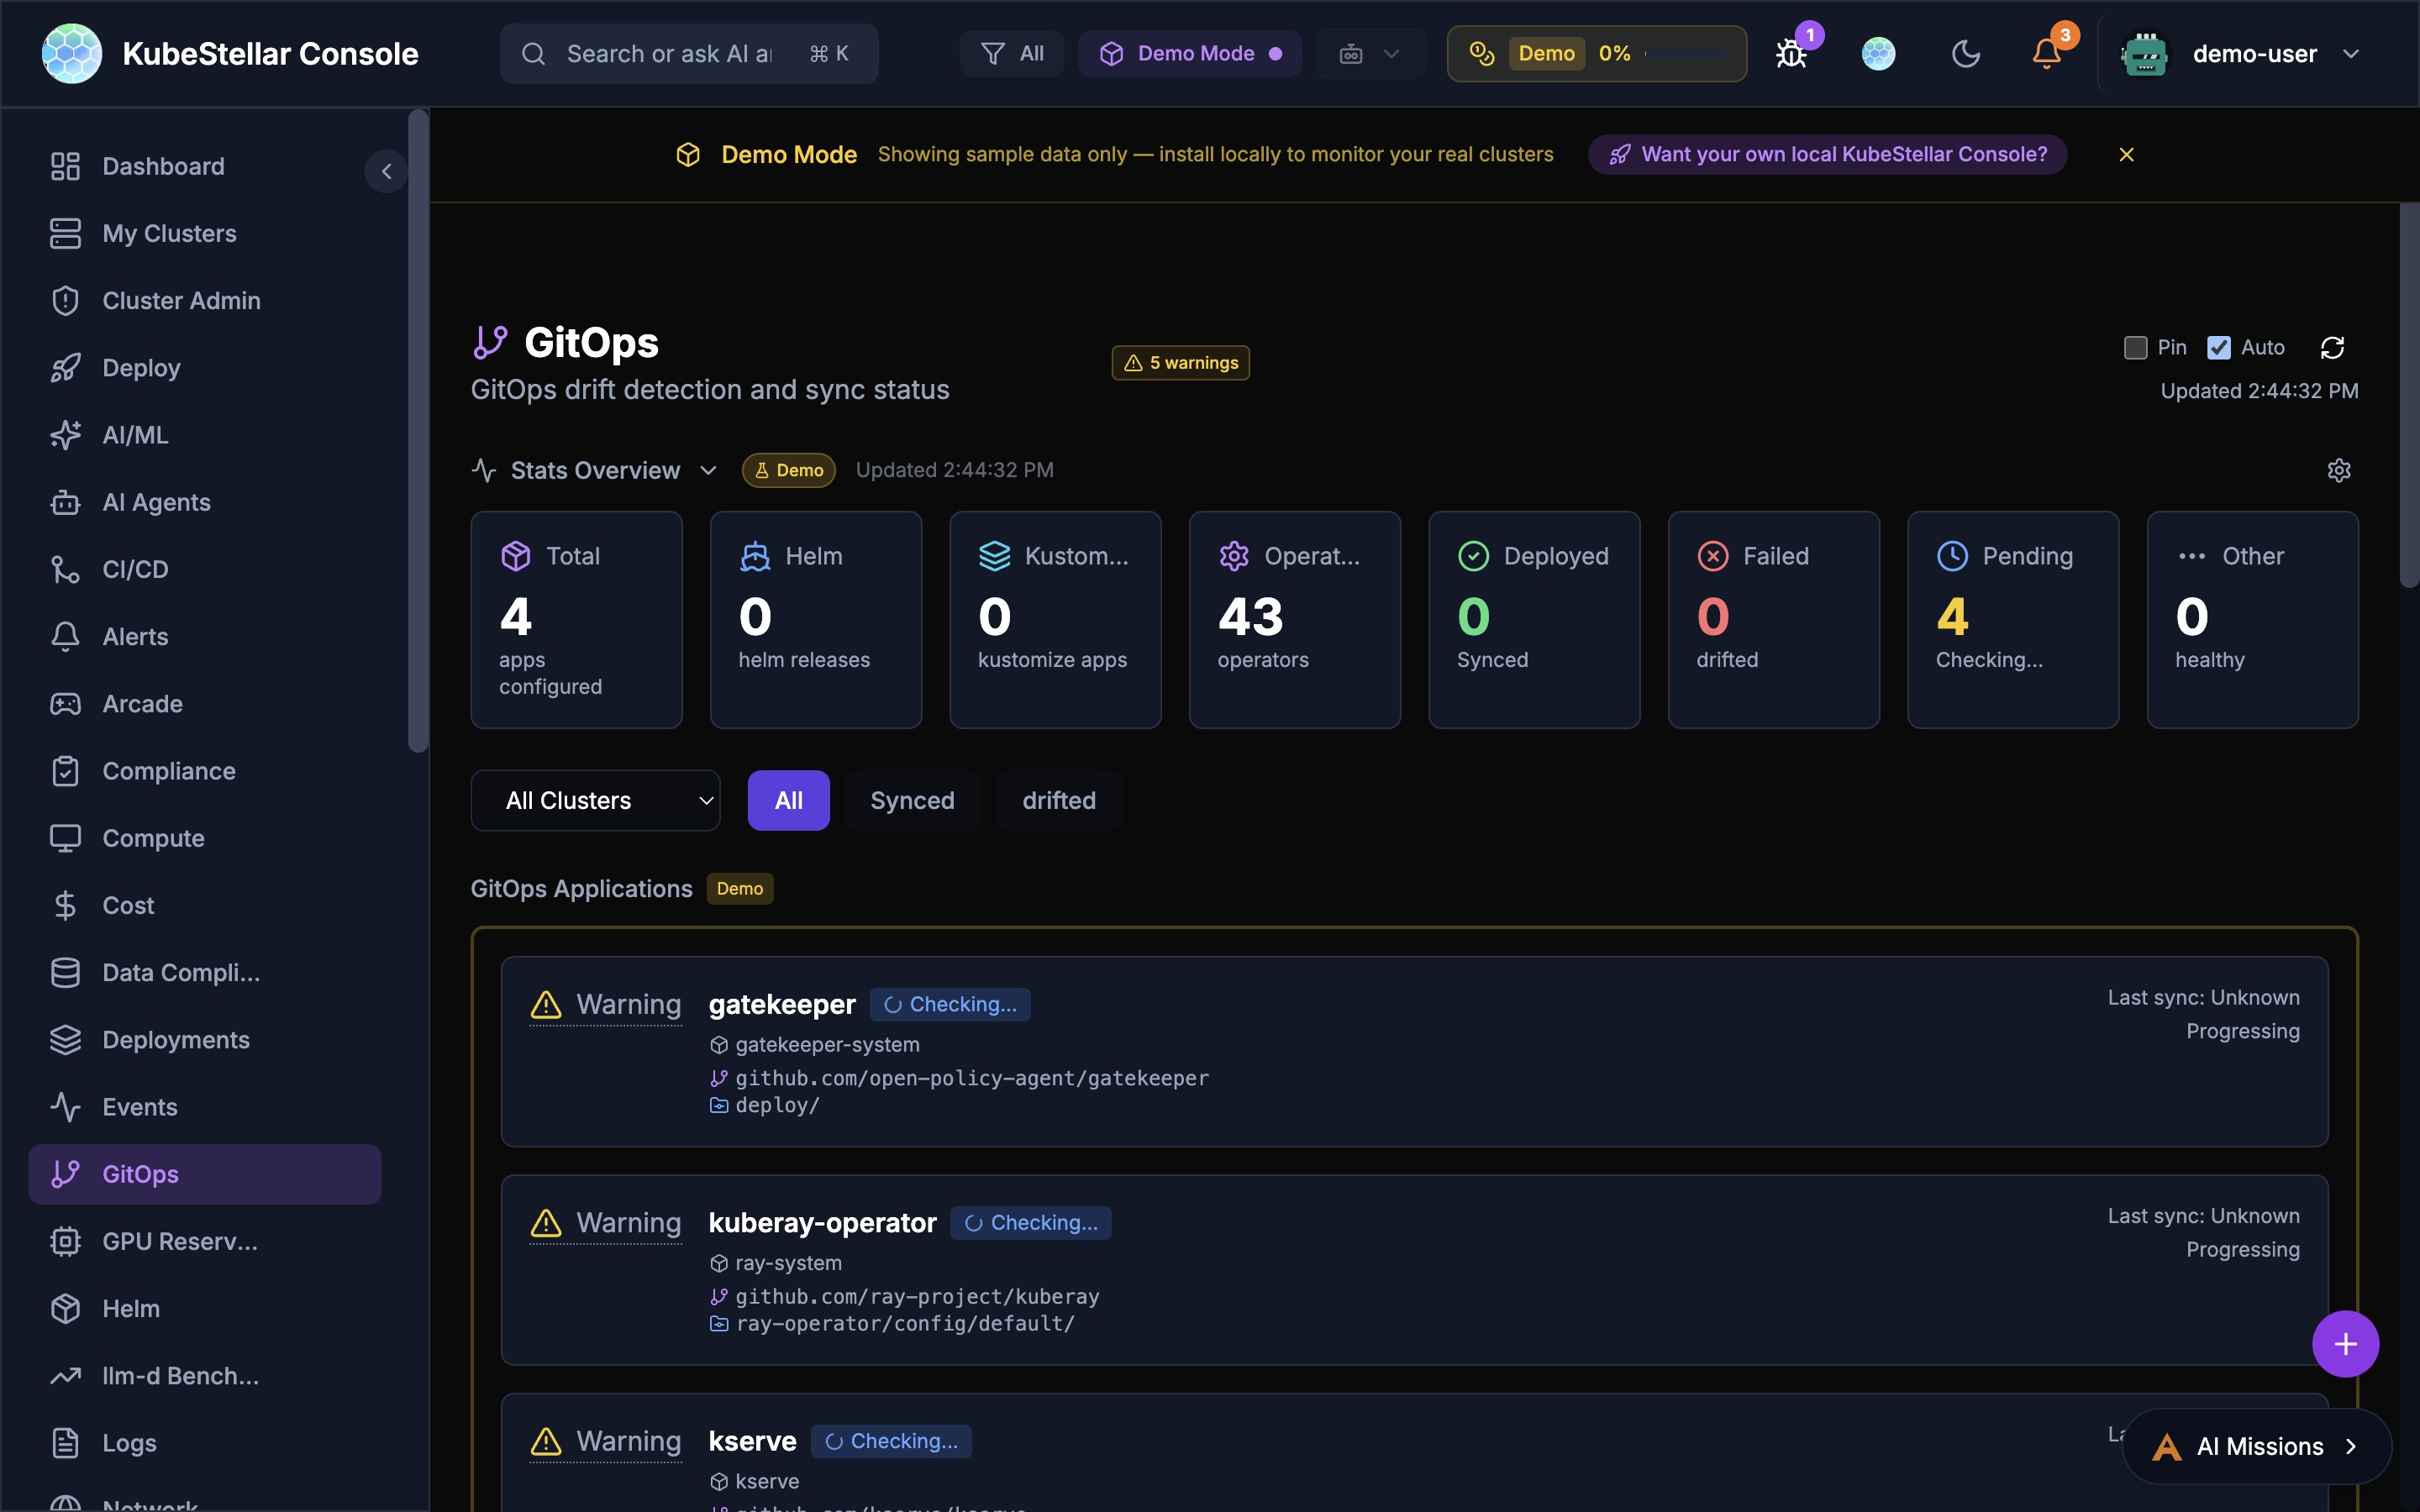
Manage GitOps:
- Helm releases and their status (295 releases)
- Kustomizations
- ArgoCD applications with Sync Now button for immediate sync
- GitOps Restart tab in ArgoCD drilldown for declarative application restarts
- Drift detection with deployment status tracking (391 deployments)
- Operator sync status (60 operators, 4 pending)
Best for: Managing deployments from git
Alerts Dashboard
Route: /alerts
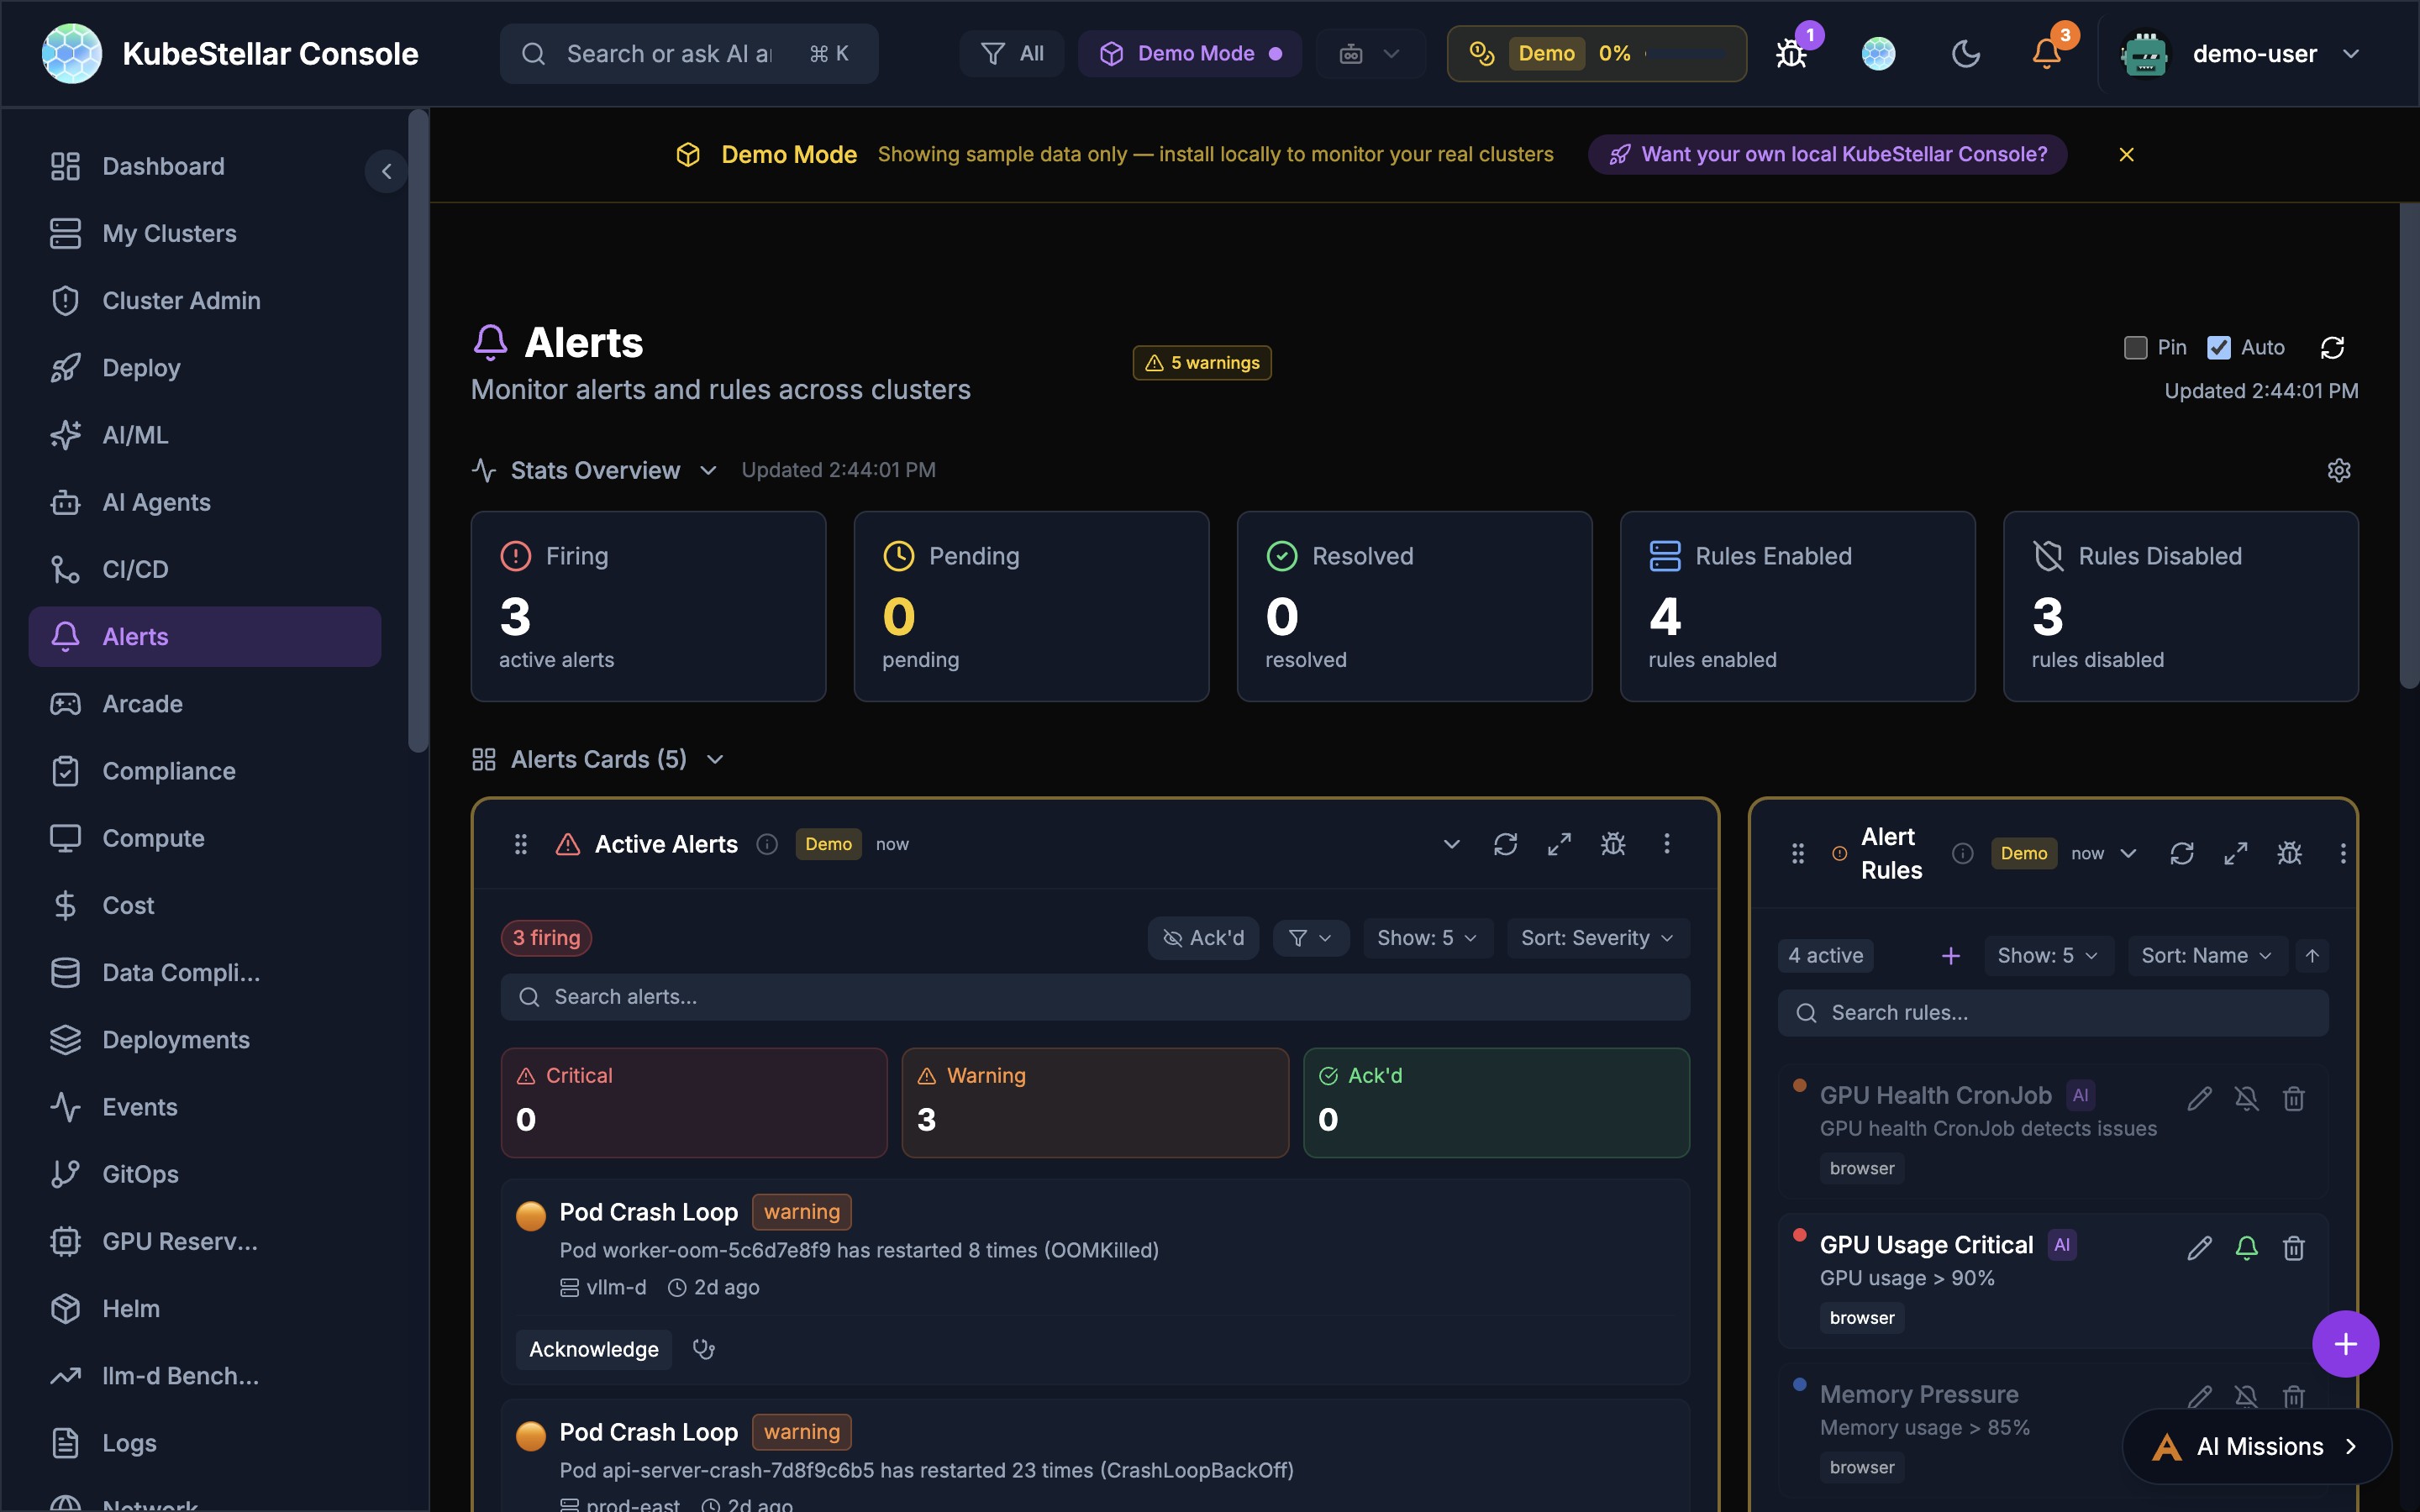
Manage alerts:
- Firing alerts with type-aware deduplication
- Pending alerts
- Alert rules you’ve created (4 enabled, 3 disabled)
- Resolved alerts (119 resolved)
- Falco integration for runtime security monitoring
- Warning Events feed
- macOS native notifications with click-to-navigate
Best for: Knowing when things need attention
GPU Reservations Dashboard
Route: /gpu-reservations
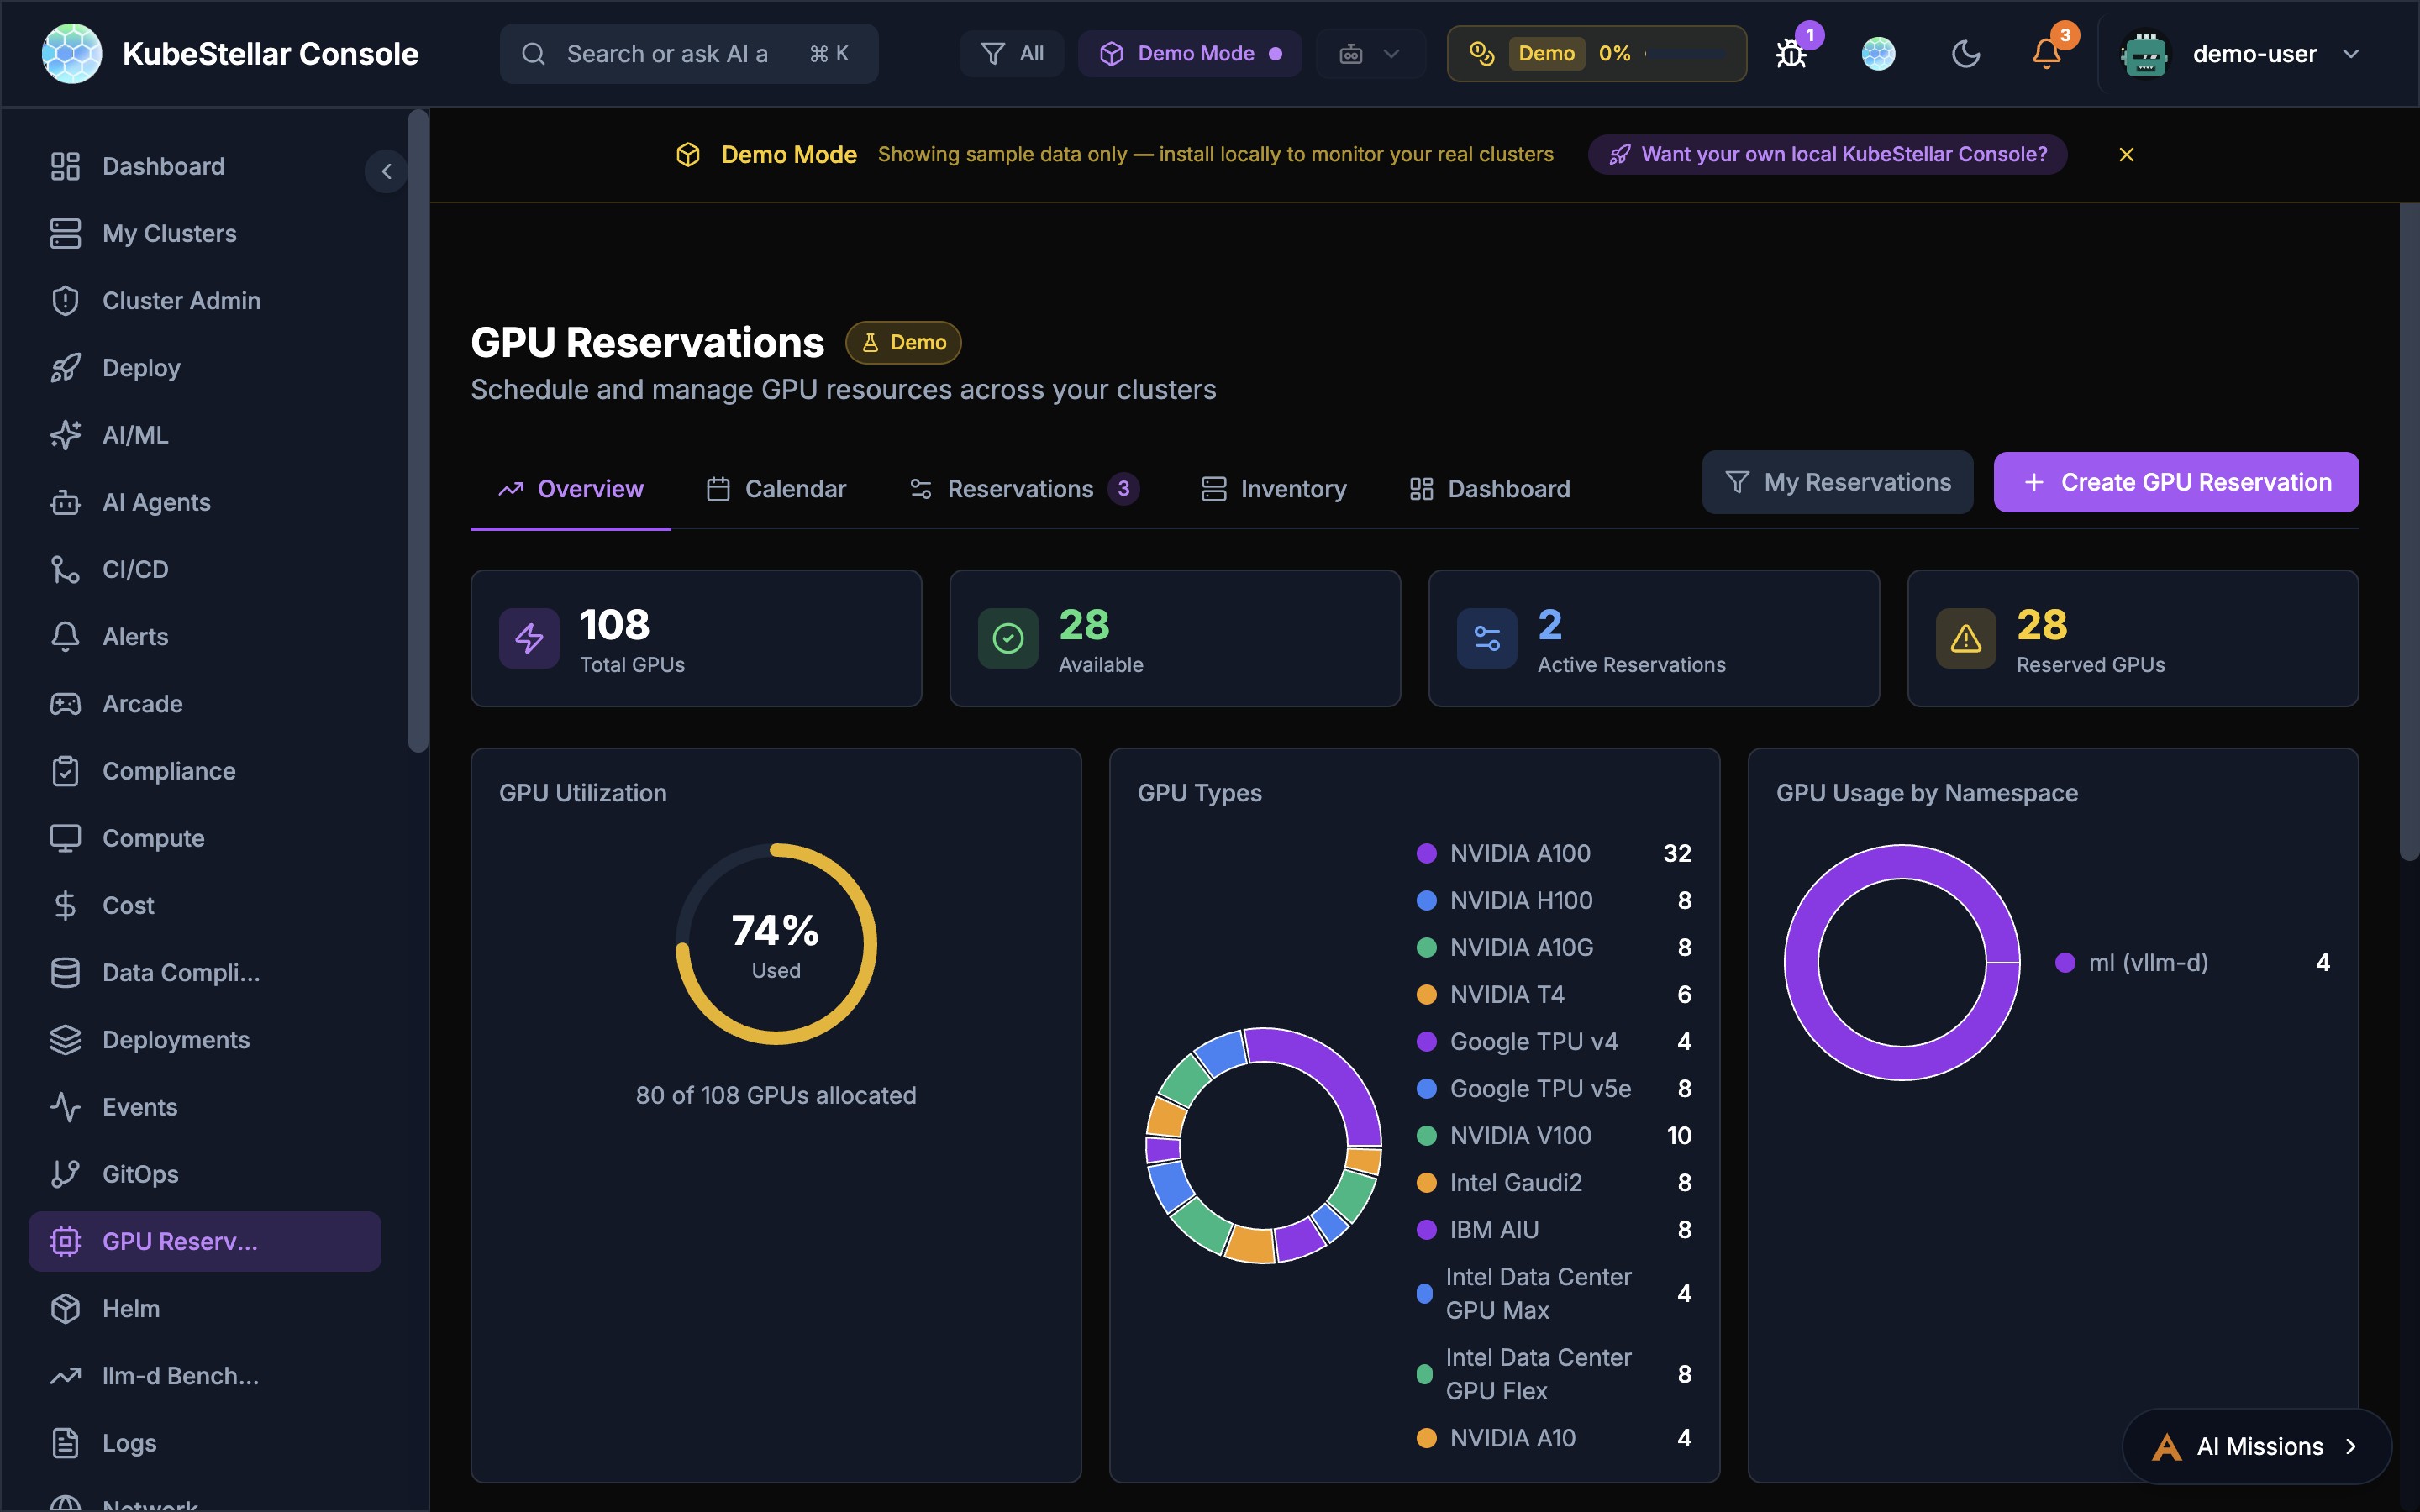
Schedule and manage GPU resources across your clusters with five dedicated tabs:
- Overview: Total GPUs, availability, utilization donut chart, GPU types breakdown, allocation by cluster
- Calendar: Visual calendar view of GPU reservations and availability windows
- Reservations: Active and pending GPU reservations with details
- Inventory: Full GPU inventory across all clusters with type, count, and status
- Dashboard: Customizable card-based view of GPU metrics
Key features:
- Create GPU reservations with namespace, cluster, and time range
- View GPU usage by namespace with donut chart breakdowns
- Track 12+ GPU types: NVIDIA A100/H100/A10G/V100/T4, Google TPU v4/v5e, Intel Gaudi2/AIU/Data Center GPU Max/Flex, IBM AIU
- GPU Allocation by Cluster bar chart for capacity planning
Best for: AI/ML teams sharing GPUs across multi-cloud environments
Cost Management Dashboard
Route: /cost
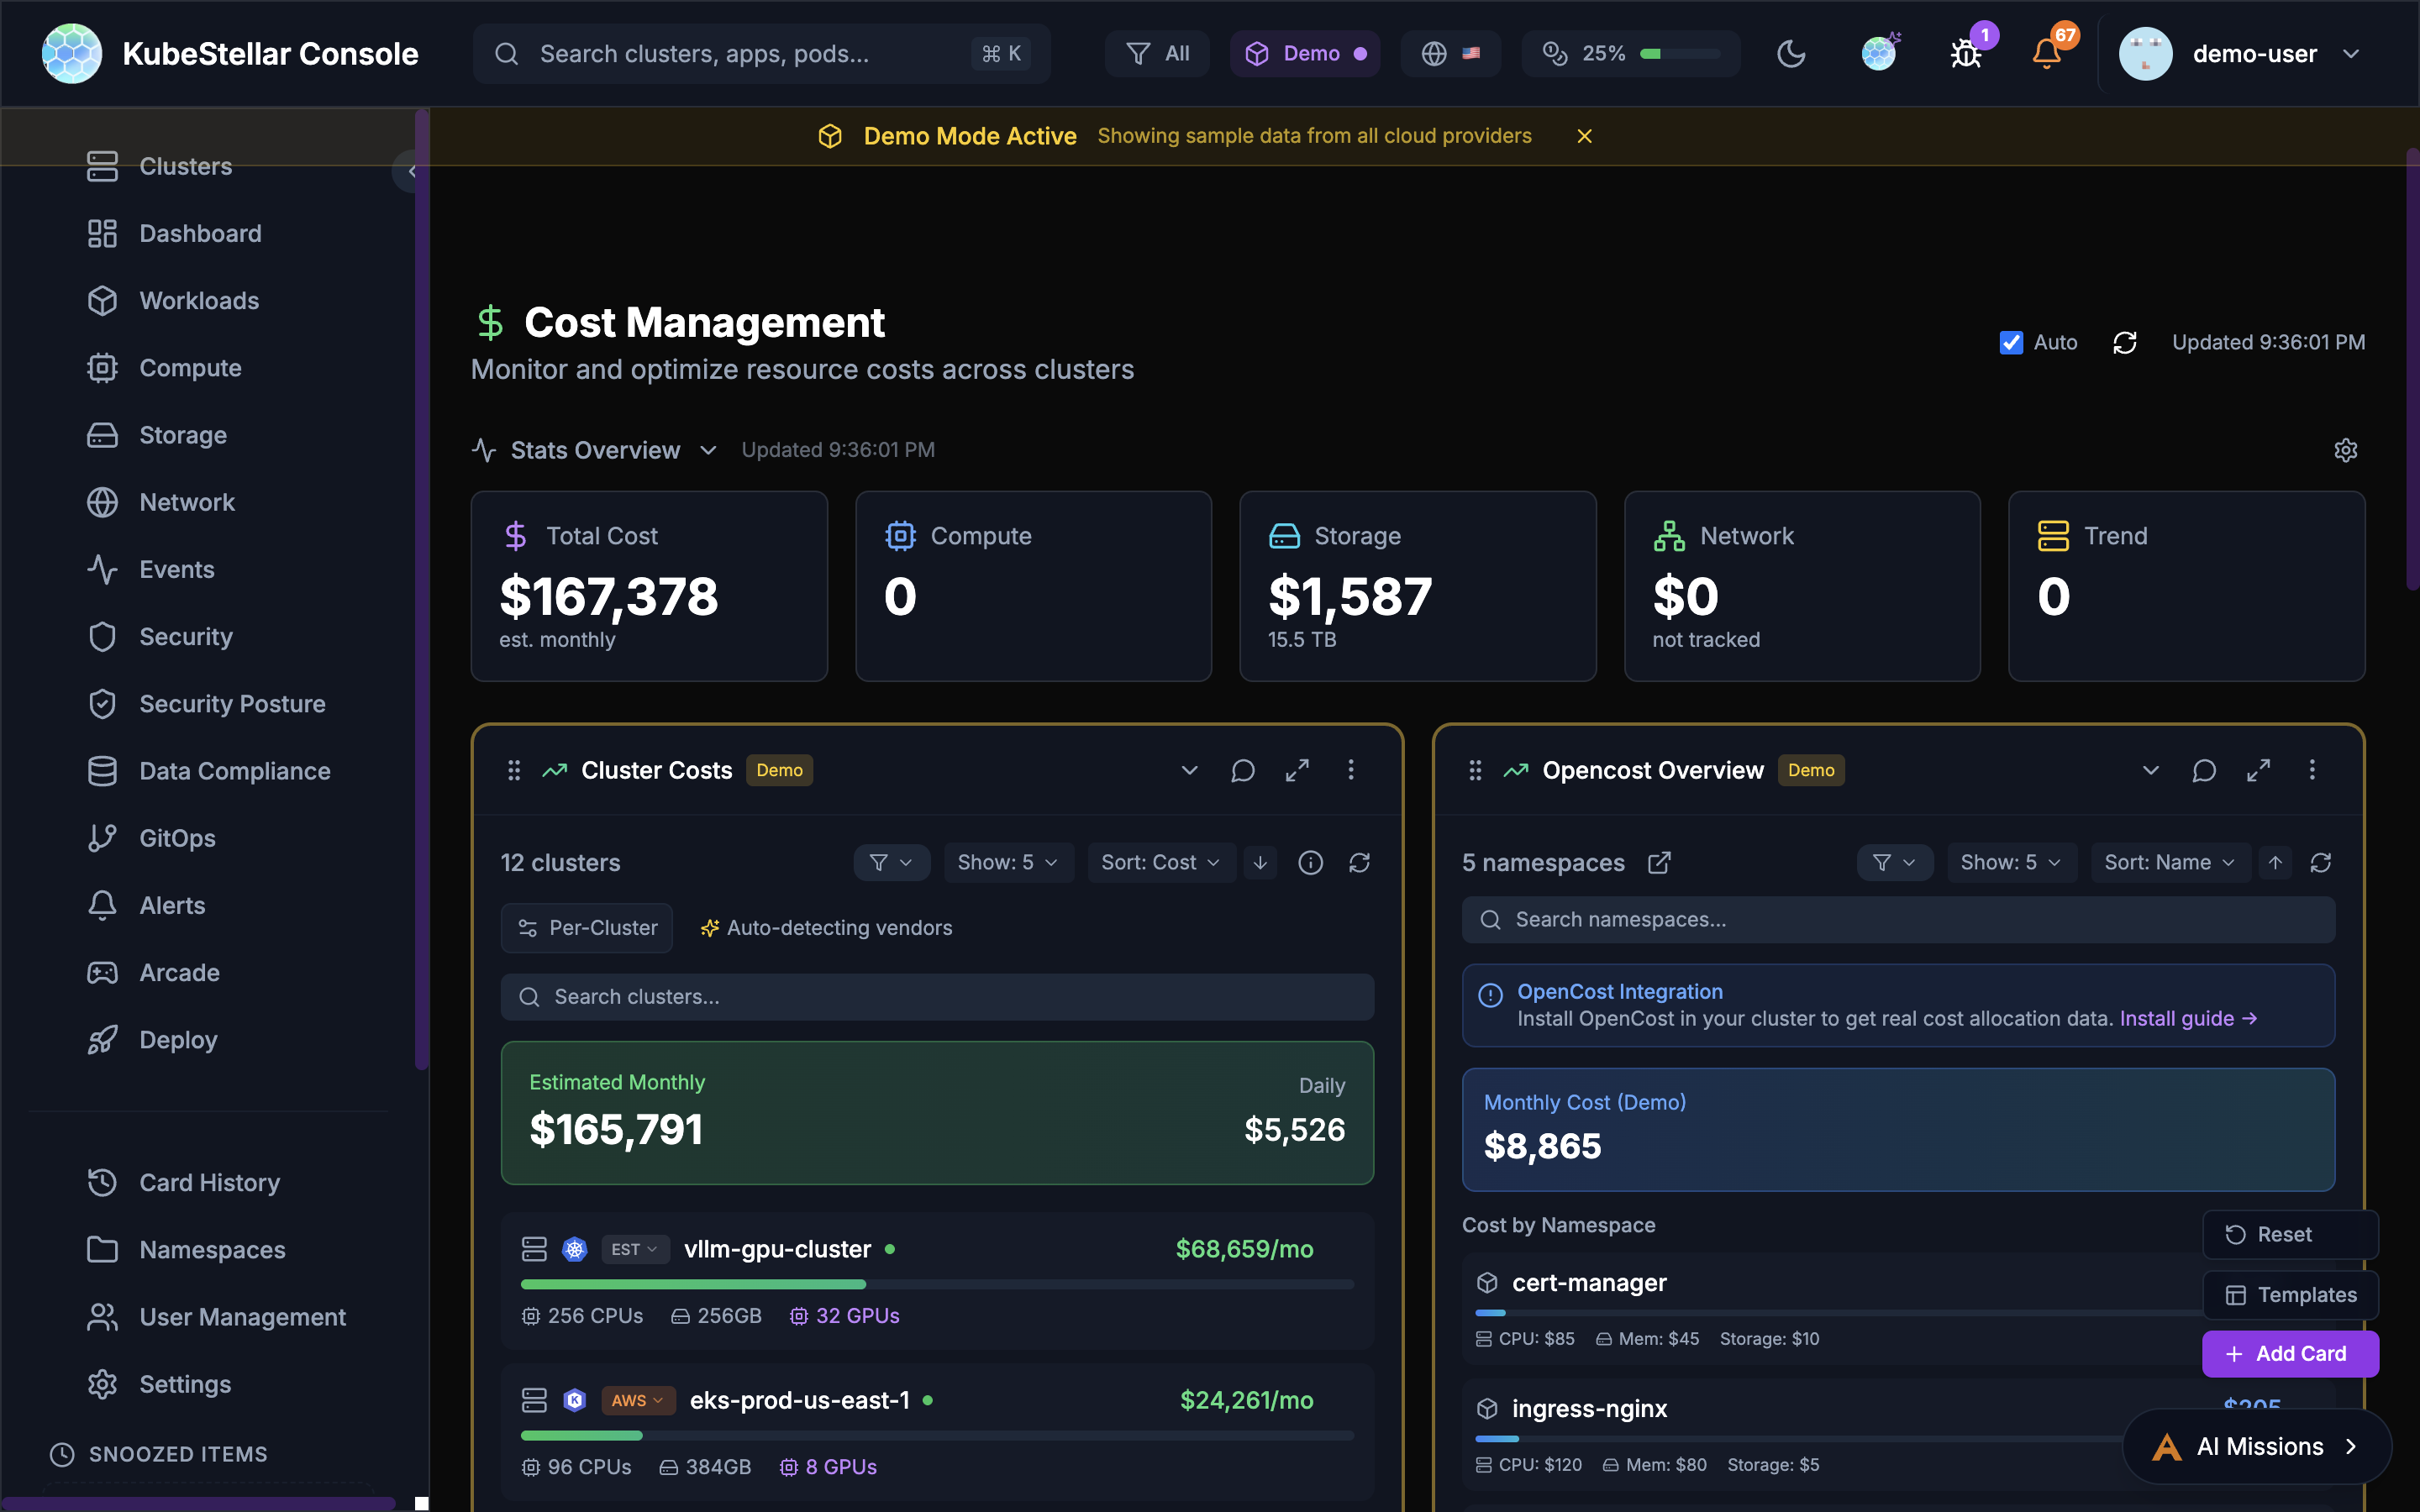
Track your spending:
- Total estimated cost
- Cost per cluster
- Cost by resource type (CPU, memory, storage)
- OpenCost and Kubecost integration
Best for: Controlling cloud spending
Compliance Dashboard
Route: /compliance
Comprehensive security scanning, vulnerability assessment, and policy enforcement across your entire fleet:
- Compliance Score: Composite score computed from OPA Gatekeeper, Kyverno, Kubescape, and Trivy data
- Stats Overview: Score, total checks, passing, failing, CIS/NSA/PCI-DSS benchmarks, Gatekeeper violations, Kyverno violations, Kubescape score
- Policy Violations: Aggregated violations from OPA + Kyverno with per-policy cluster attribution
- Fleet Compliance Heatmap: Clusters × compliance tools grid with color-coded status (green/yellow/red). Shows install CTA icons when Kyverno/Kubescape/Trivy aren’t detected, linking to AI Mission install flows
- Compliance Drift: Flags clusters deviating >1 standard deviation from fleet baseline compliance scores
- Cross-Cluster Policy Comparison: Select up to 4 clusters and compare policy pass/fail in a table sorted by most discrepancies
- Kyverno Policies: Live per-cluster policy data via CRD auto-detection
- Kubescape Scan: Per-cluster framework scores via API aggregation or CRD check
- Trivy Scan: Per-cluster vulnerability counts by severity
- Cert Manager: Certificate expiry tracking across clusters
New in March 2026:
- All compliance cards rewritten to use live per-cluster data (previously static demo data)
- New
useKyverno,useTrivy,useKubescapehooks with CRD auto-detection, localStorage caching, and demo fallback - 3 new cross-cluster comparison cards (Fleet Compliance Heatmap, Compliance Drift, Cross-Cluster Policy Comparison)
- Install CTA icons in heatmap headers link to AI Missions for one-click tool installation
Best for: Enterprise security compliance, fleet-wide posture assessment, and identifying outlier clusters
Logs Dashboard
Route: /logs
View logs:
- Container logs from any pod
- Filter by namespace or pod
- Search log content
Best for: Debugging application issues
Helm Releases Dashboard
Route: /helm
Manage Helm:
- All Helm releases
- Release history
- Values comparison
- Available upgrades
Best for: Managing Helm deployments
Services Dashboard
Route: /services
See all services:
- ClusterIP services
- LoadBalancer services
- NodePort services
- Endpoints
Best for: Understanding service networking
Operators Dashboard
Route: /operators
Manage operators:
- OLM operators
- Subscriptions
- Available updates
Best for: Managing cluster extensions
Nodes Dashboard
Route: /nodes
See your nodes:
- Node health status
- Resource usage per node
- Node labels and taints
Best for: Infrastructure monitoring
Deployments Dashboard
Route: /deployments
Focus on deployments:
- All deployments across clusters
- Replica counts
- Rollout status
Best for: Application deployment status
Pods Dashboard
Route: /pods
Focus on pods:
- All pods across clusters
- Pod status
- Restart counts
- Resource usage
Best for: Detailed pod troubleshooting
AI/ML Dashboard
Route: /ai-ml
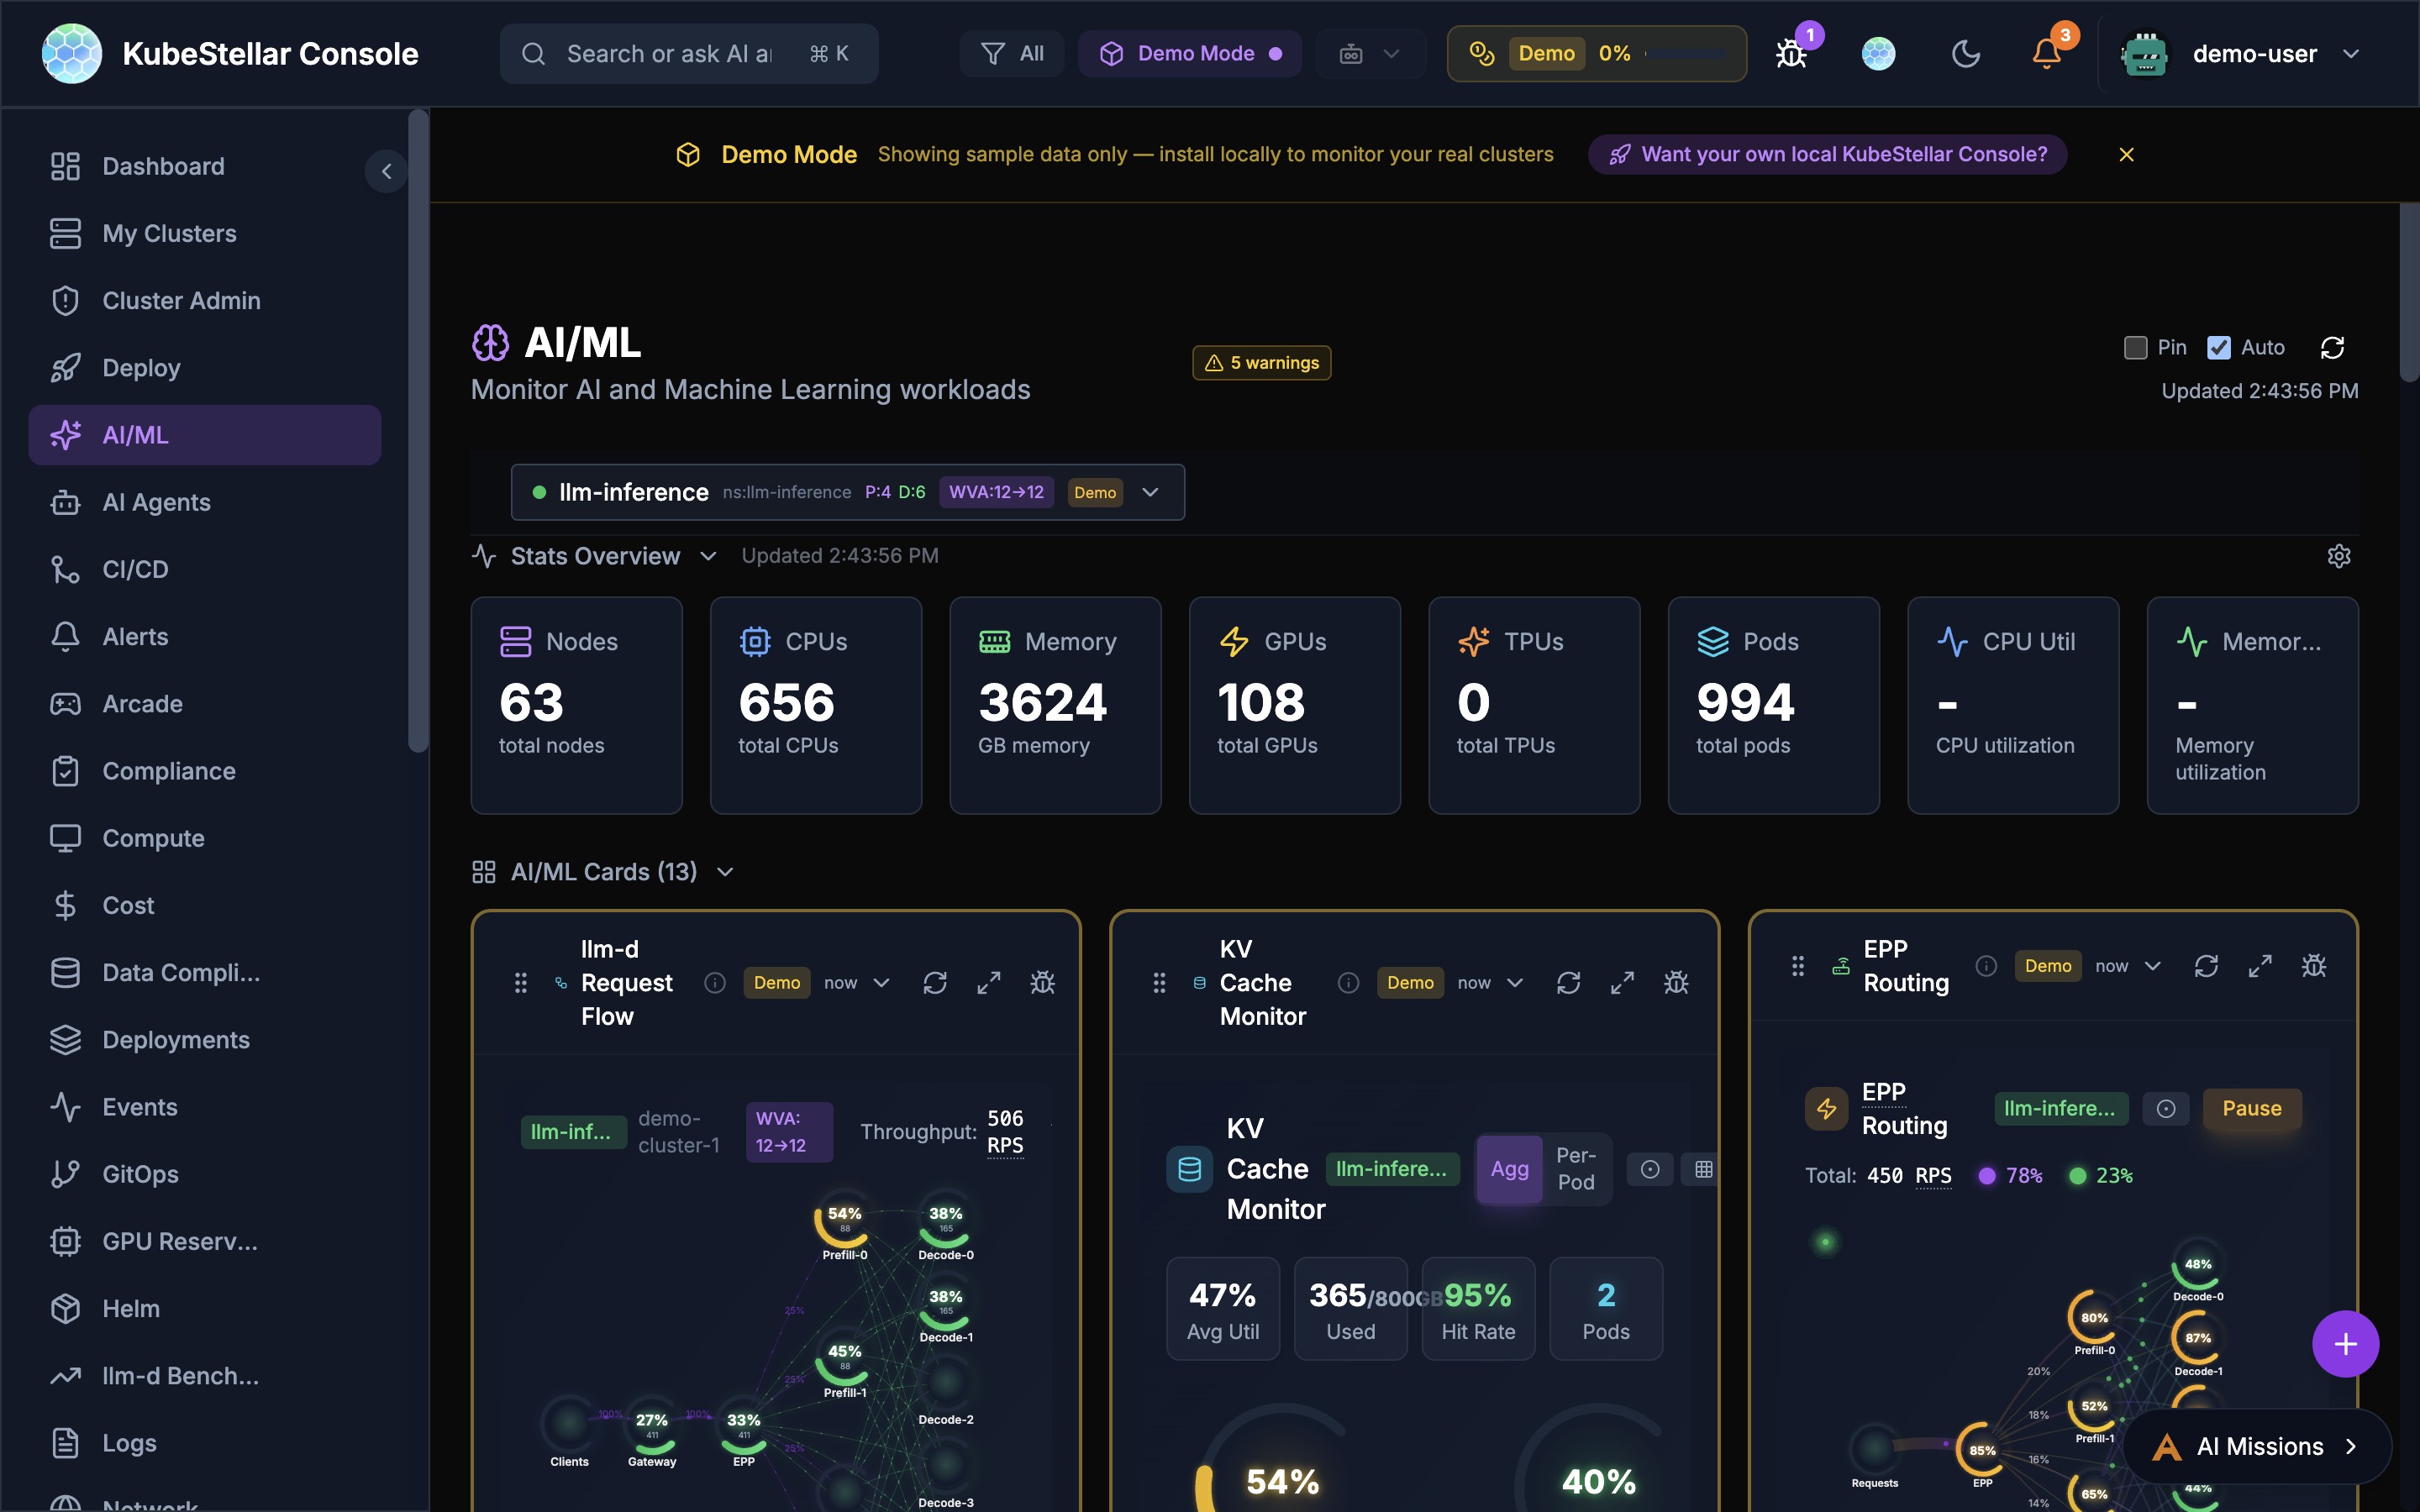
Monitor AI and Machine Learning workloads:
- llm-d inference stack monitoring (Request Flow, KV Cache, EPP Routing)
- Prefill/Decode disaggregation metrics
- llm-d benchmarks and comparisons
- ML Jobs and Notebooks
- GPU Overview with type breakdown
- Hardware Health monitoring
- Node Offline Detection with AI predictions
Best for: Managing AI/ML infrastructure and LLM serving stacks
llm-d Benchmarks Dashboard
Route: /llm-d-benchmarks
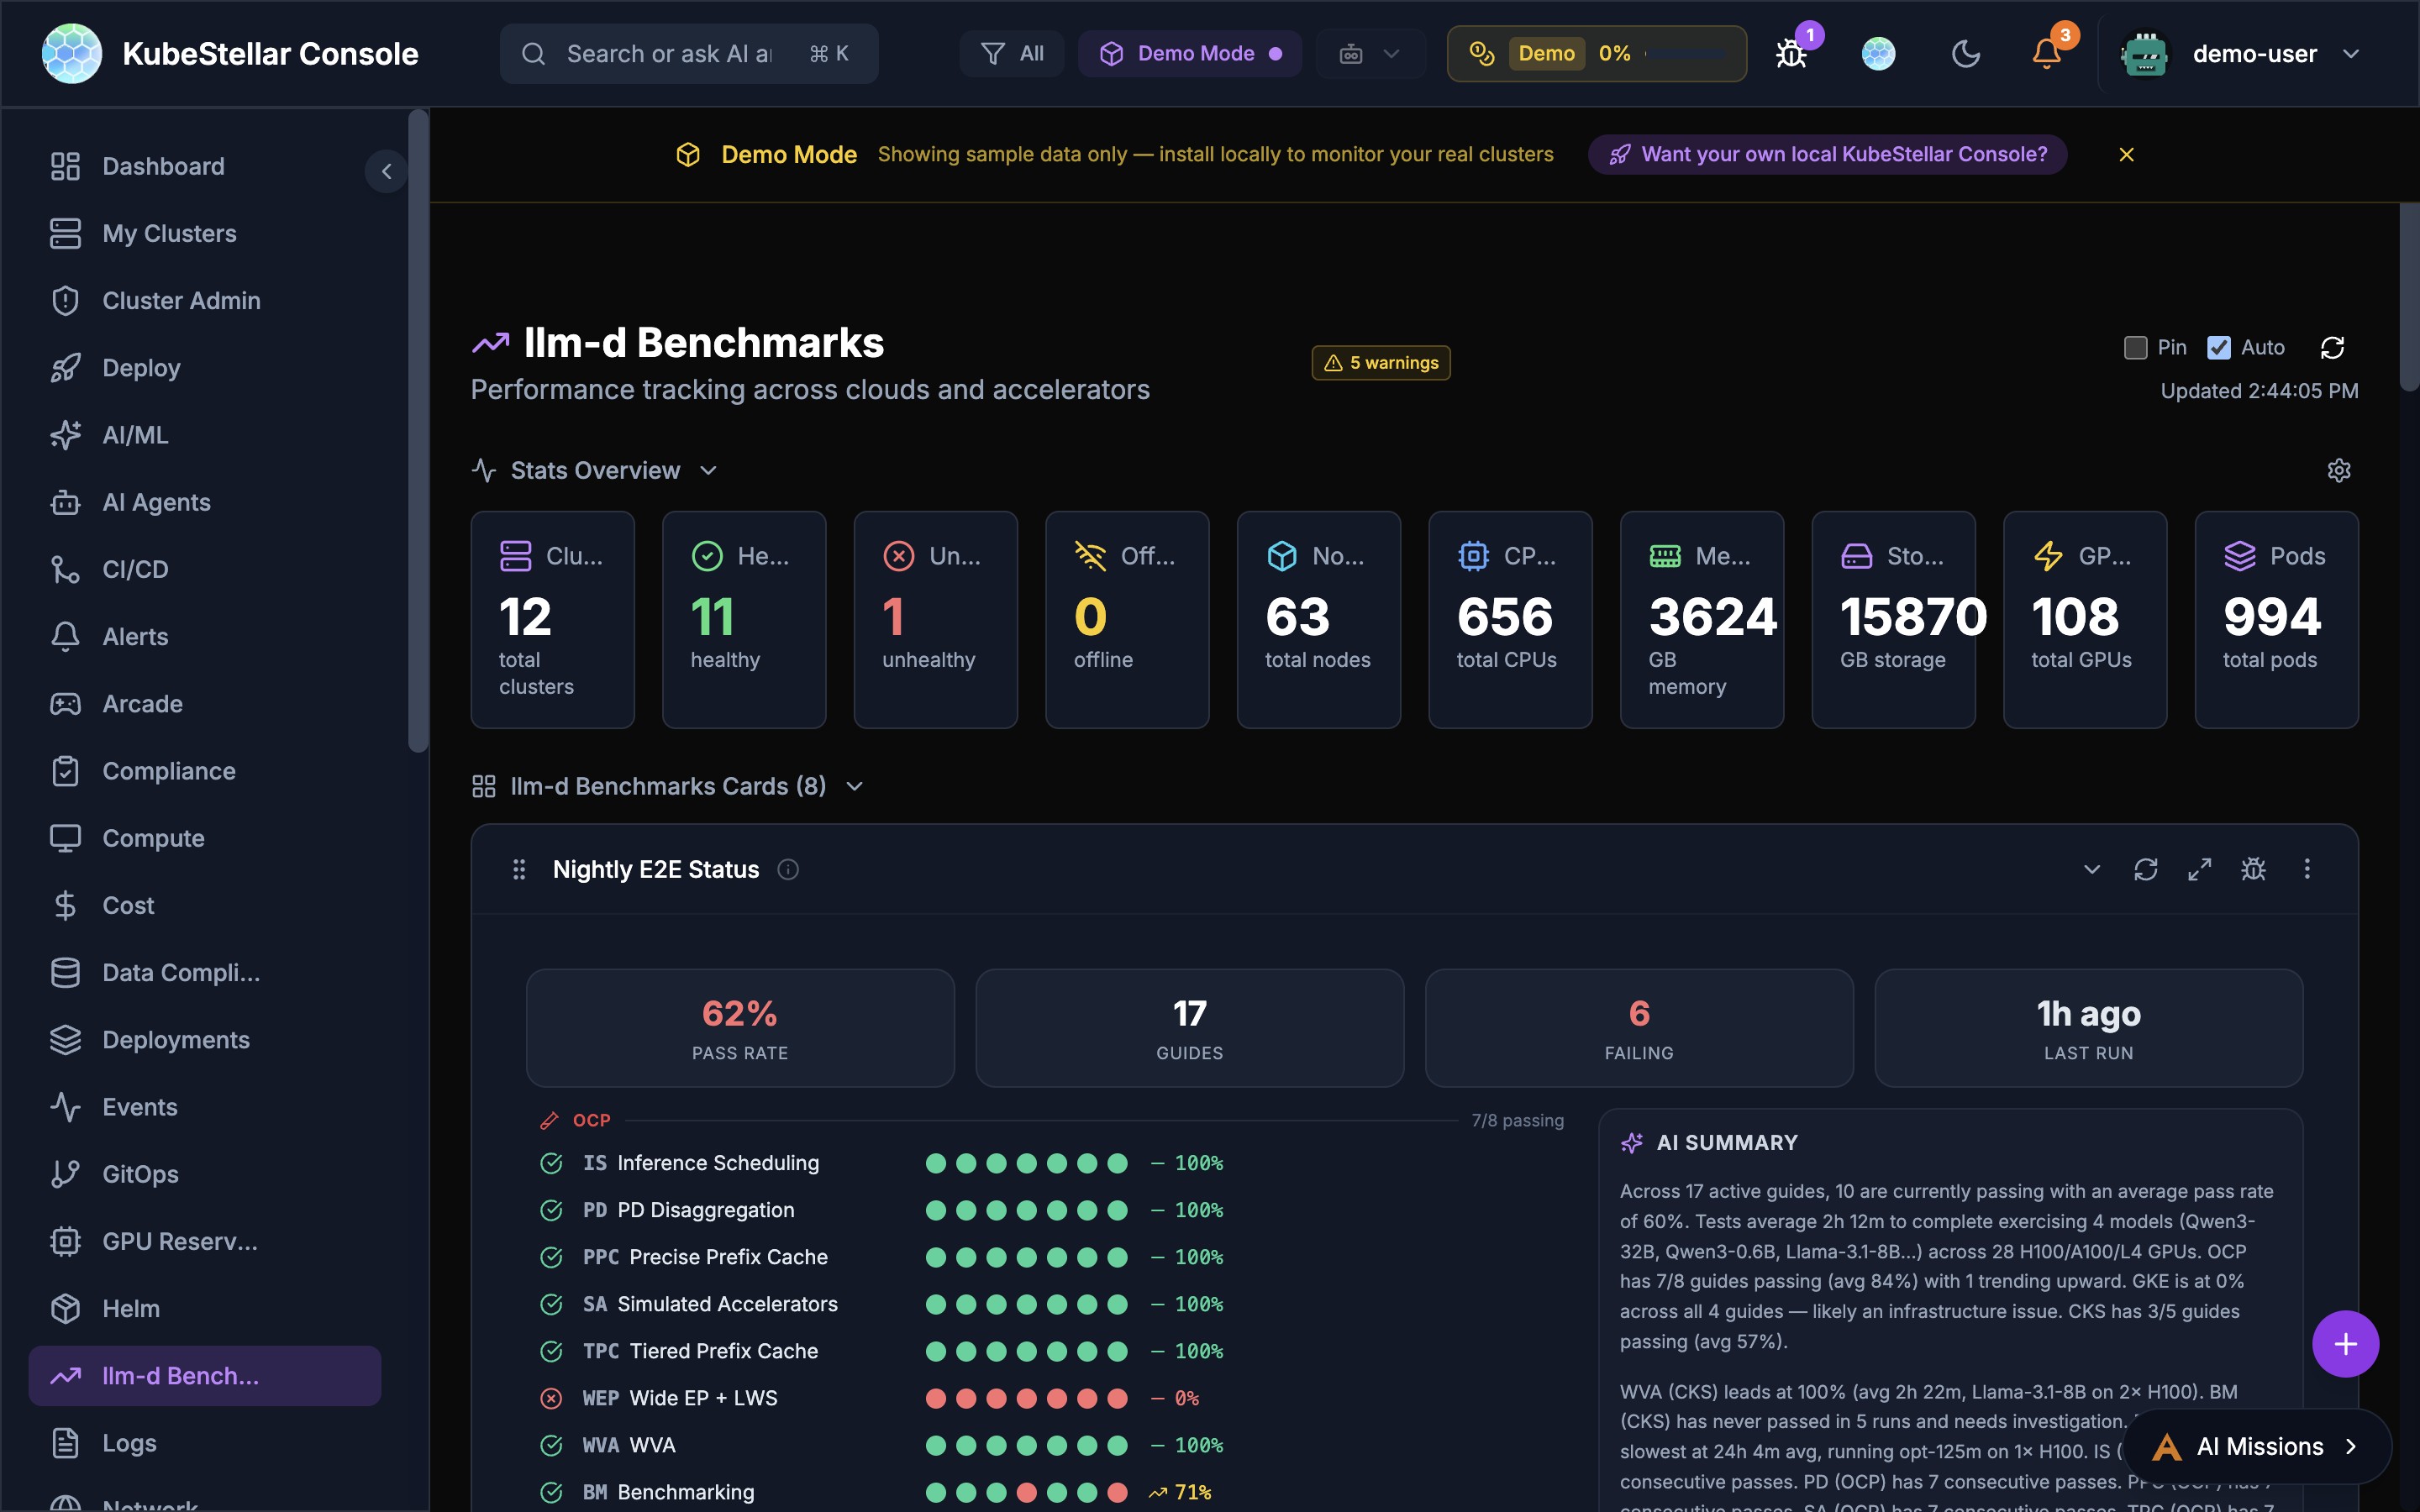
Performance tracking across clouds and accelerators for the llm-d inference stack:
- Nightly E2E Status: Real-time pass rates across 16 guides on OCP, GKE, and CKS platforms with per-guide green/red dot matrix and AI-generated summary
- Pareto Frontier: Tabbed chart views comparing throughput vs. latency tradeoffs across configurations
- Leaderboard: Ranked model/configuration comparison with pagination
- Benchmark Hero: Summary metrics from the latest benchmark runs
- Live Data: Streams benchmark results from Google Drive via SSE (Server-Sent Events) with automatic fallback to demo data
The Nightly E2E Status card features:
- 89% overall pass rate with 16 active guides
- Per-platform breakdown (OCP, GKE, CKS) with individual pass rates
- Sparkline trend graph showing pass rate over time
- AI summary with duration, model, and GPU information
- Detail panel with per-guide status and last run timestamps
Best for: Tracking llm-d inference stack performance and CI health across platforms
AI Agents Dashboard
Route: /ai-agents
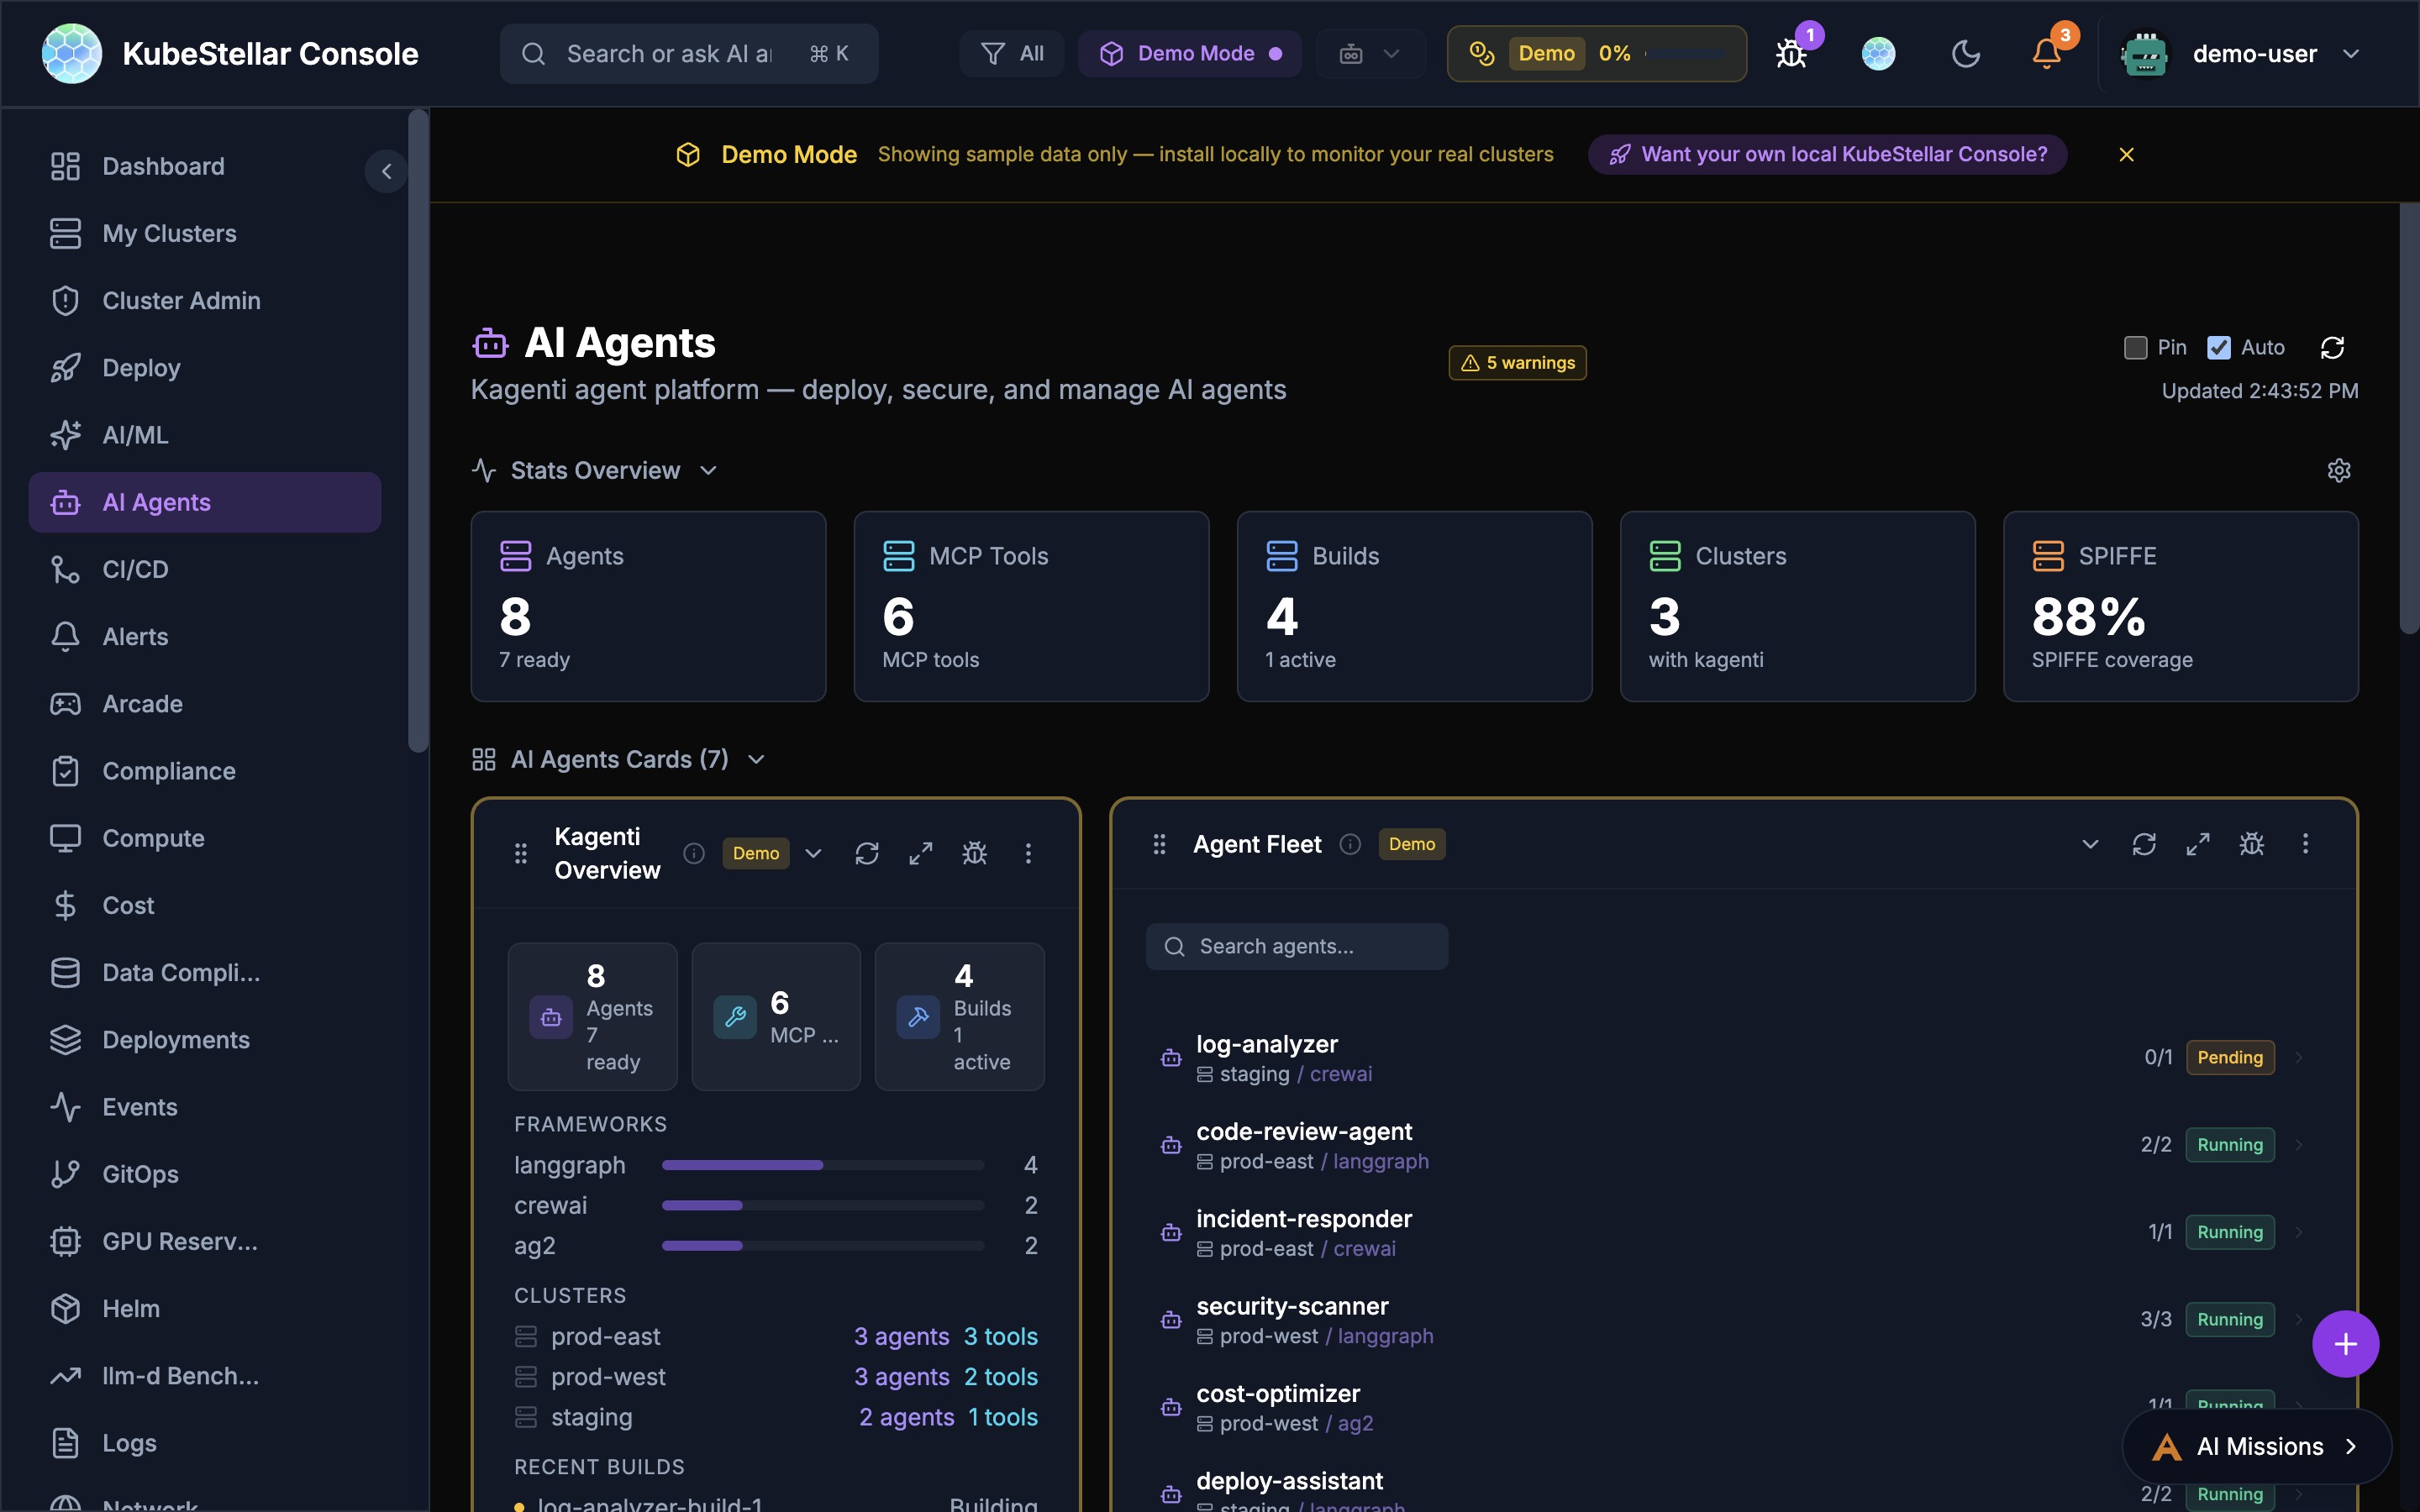
Manage Kagenti AI agents:
- Agent fleet overview across clusters with on/off toggle and “Live” indicator
- MCP Tool Registry with searchable tool listing
- Agent Discovery with skill tags and cost analysis capabilities
- Build Pipeline with recent build history and status
- Framework breakdown (LangGraph, CrewAI, AG2)
- Agent build status and history
- SPIFFE identity coverage
- Per-agent replica status and cluster placement
- Agent memory persistence across sessions
Best for: Deploying, securing, and monitoring AI agents
CI/CD Dashboard
Route: /ci-cd
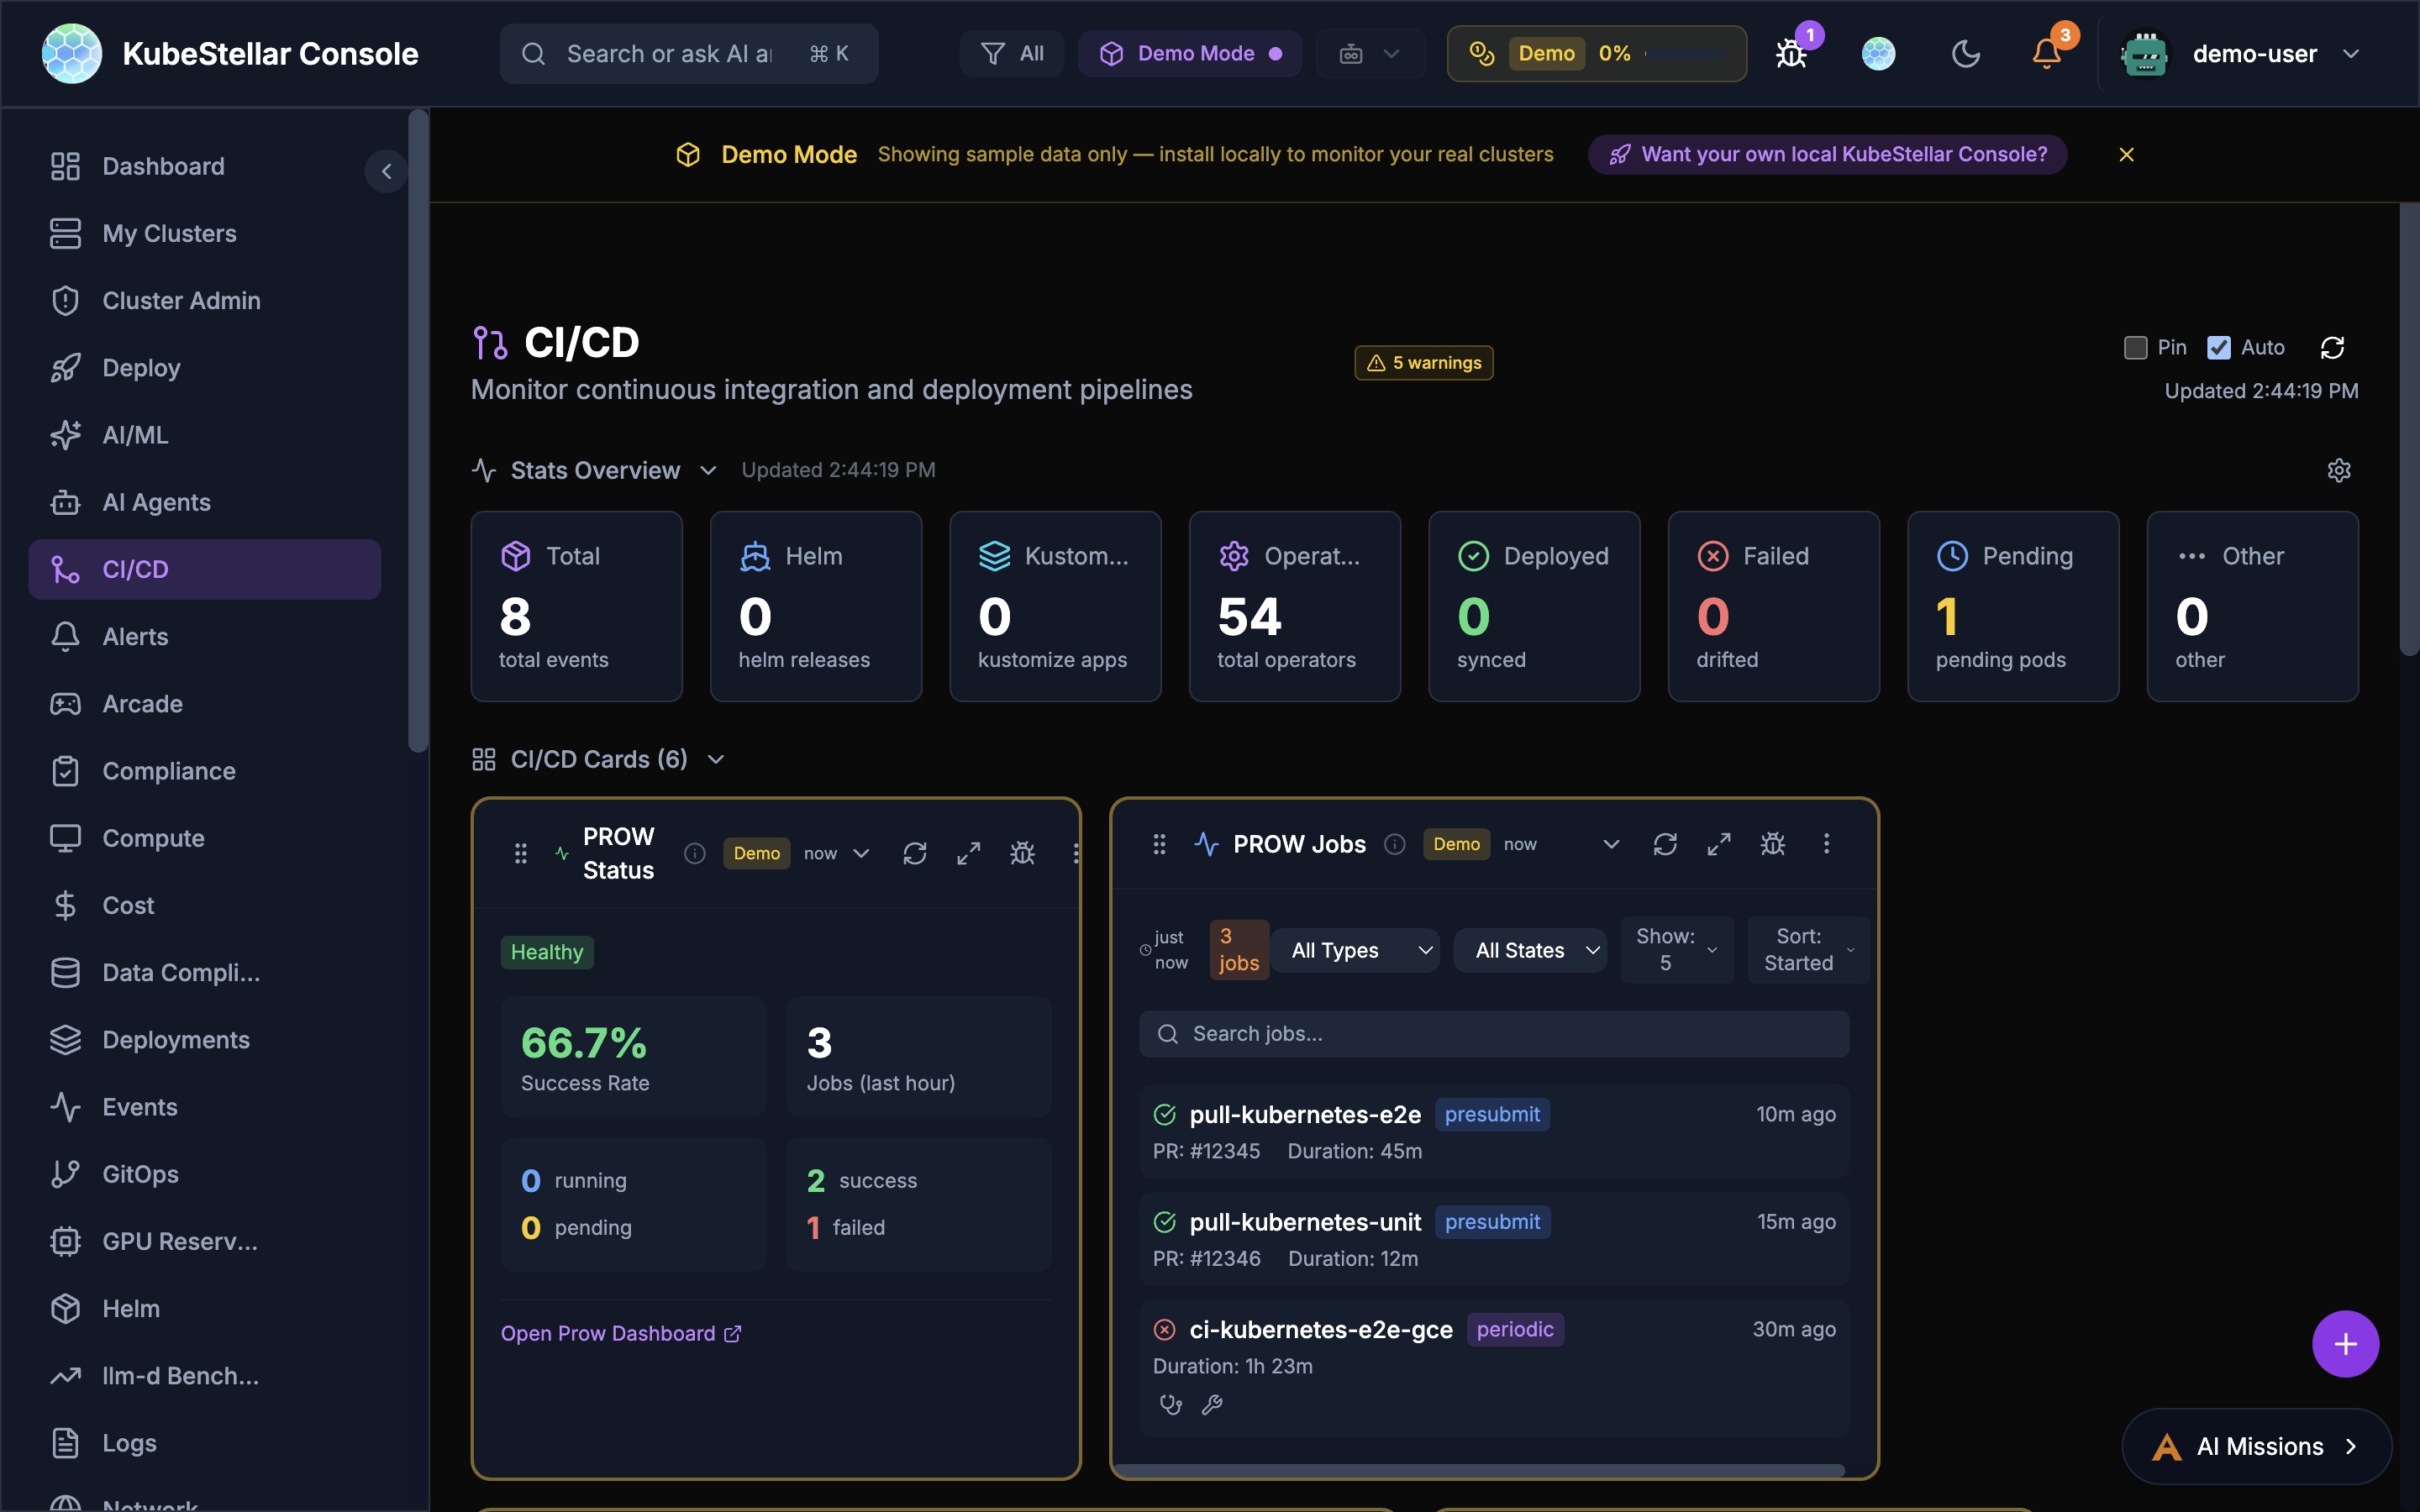
Monitor continuous integration and deployment:
- PROW CI status and success rates
- PROW Jobs with type/state filtering and pagination
- PROW CI Monitor with success rate tracking
- PROW revision history
- Helm release tracking (295 releases)
- Kustomize and ArgoCD sync status
- Operator deployments (5,412 total, 287 deployed, 4 pending)
Best for: Monitoring CI/CD pipelines and PROW test infrastructure
Deploy Dashboard
Route: /deploy
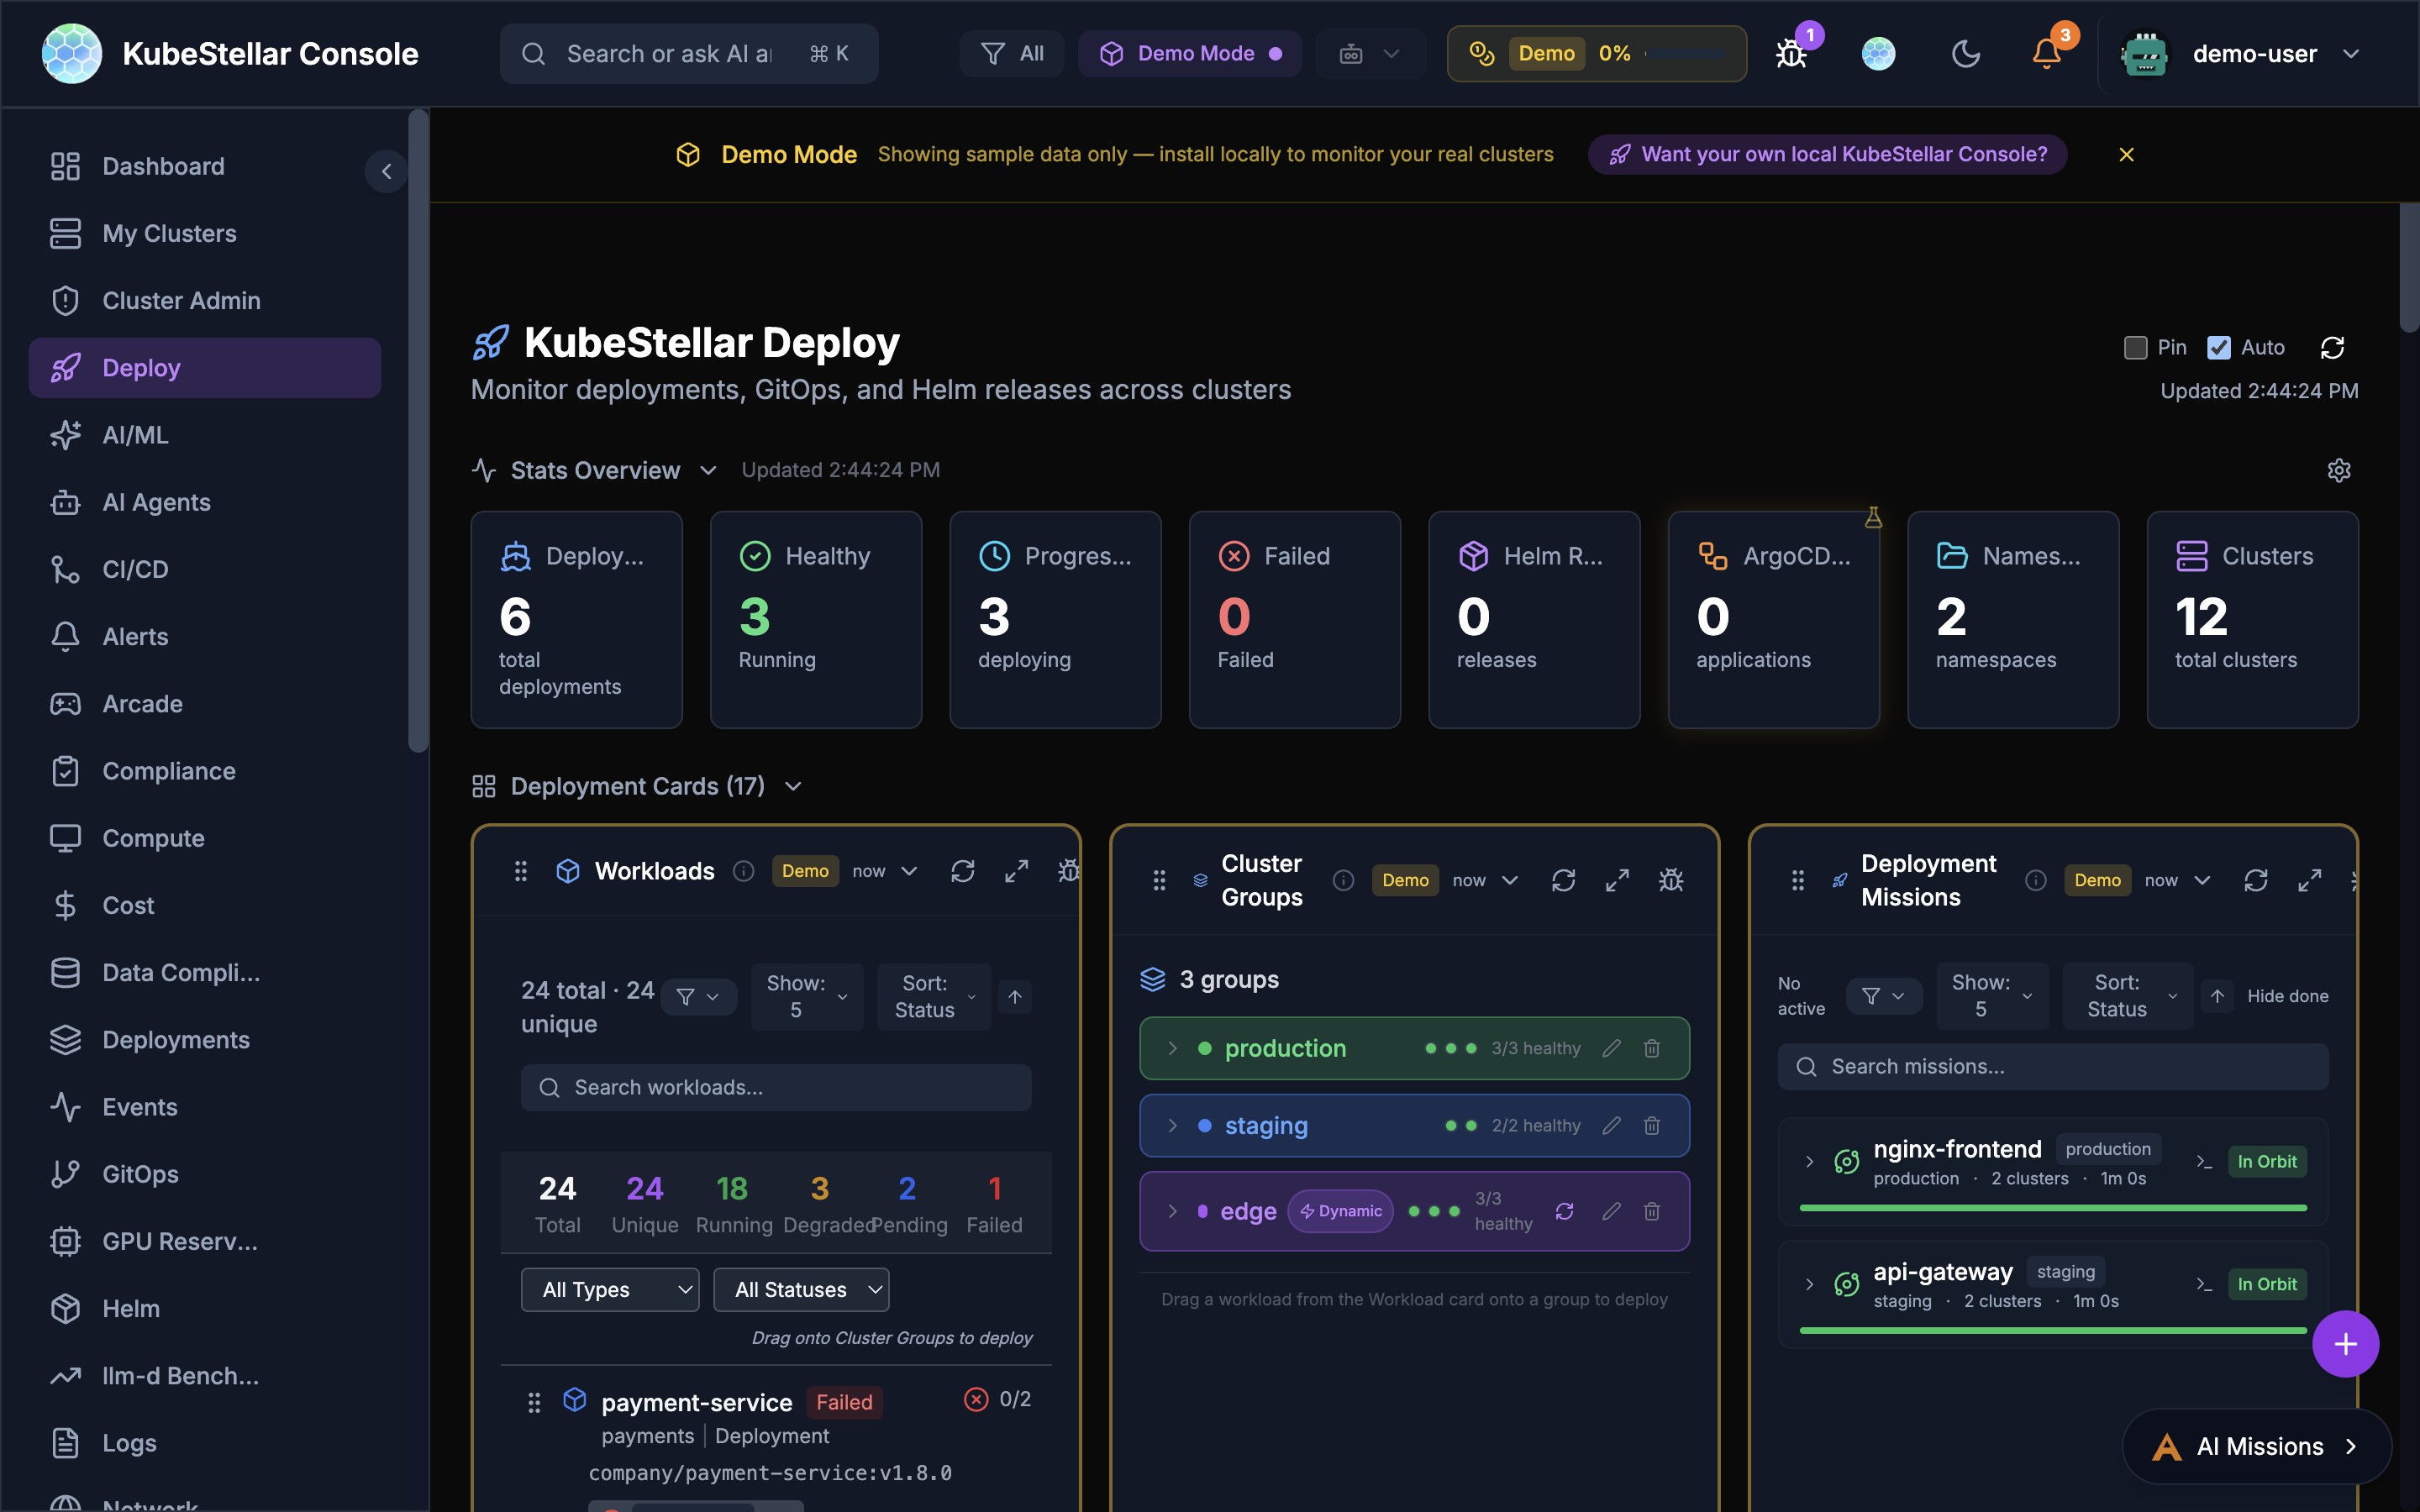
Multi-cluster deployment management:
- Workloads overview with drag-to-deploy (659 total, 553 unique)
- Cluster Groups for targeting deployments
- Deployment Missions with AI-assisted rollouts and Mission Browser
- Mission Browser with Installer and Solution tabs for discovering pre-built missions
- Deep-linking and sharing for missions with OAuth flow support
- Saved Missions panel for quick access
- Resource Marshall for workload placement
- Deployment history and rollback
Best for: Deploying and managing workloads across multiple clusters
Data Compliance Dashboard
Route: /data-compliance
Monitor data compliance:
- Data classification status
- Compliance checks and violations
- Policy enforcement across clusters
Best for: Meeting data governance requirements
Insights Dashboard
Route: /insights
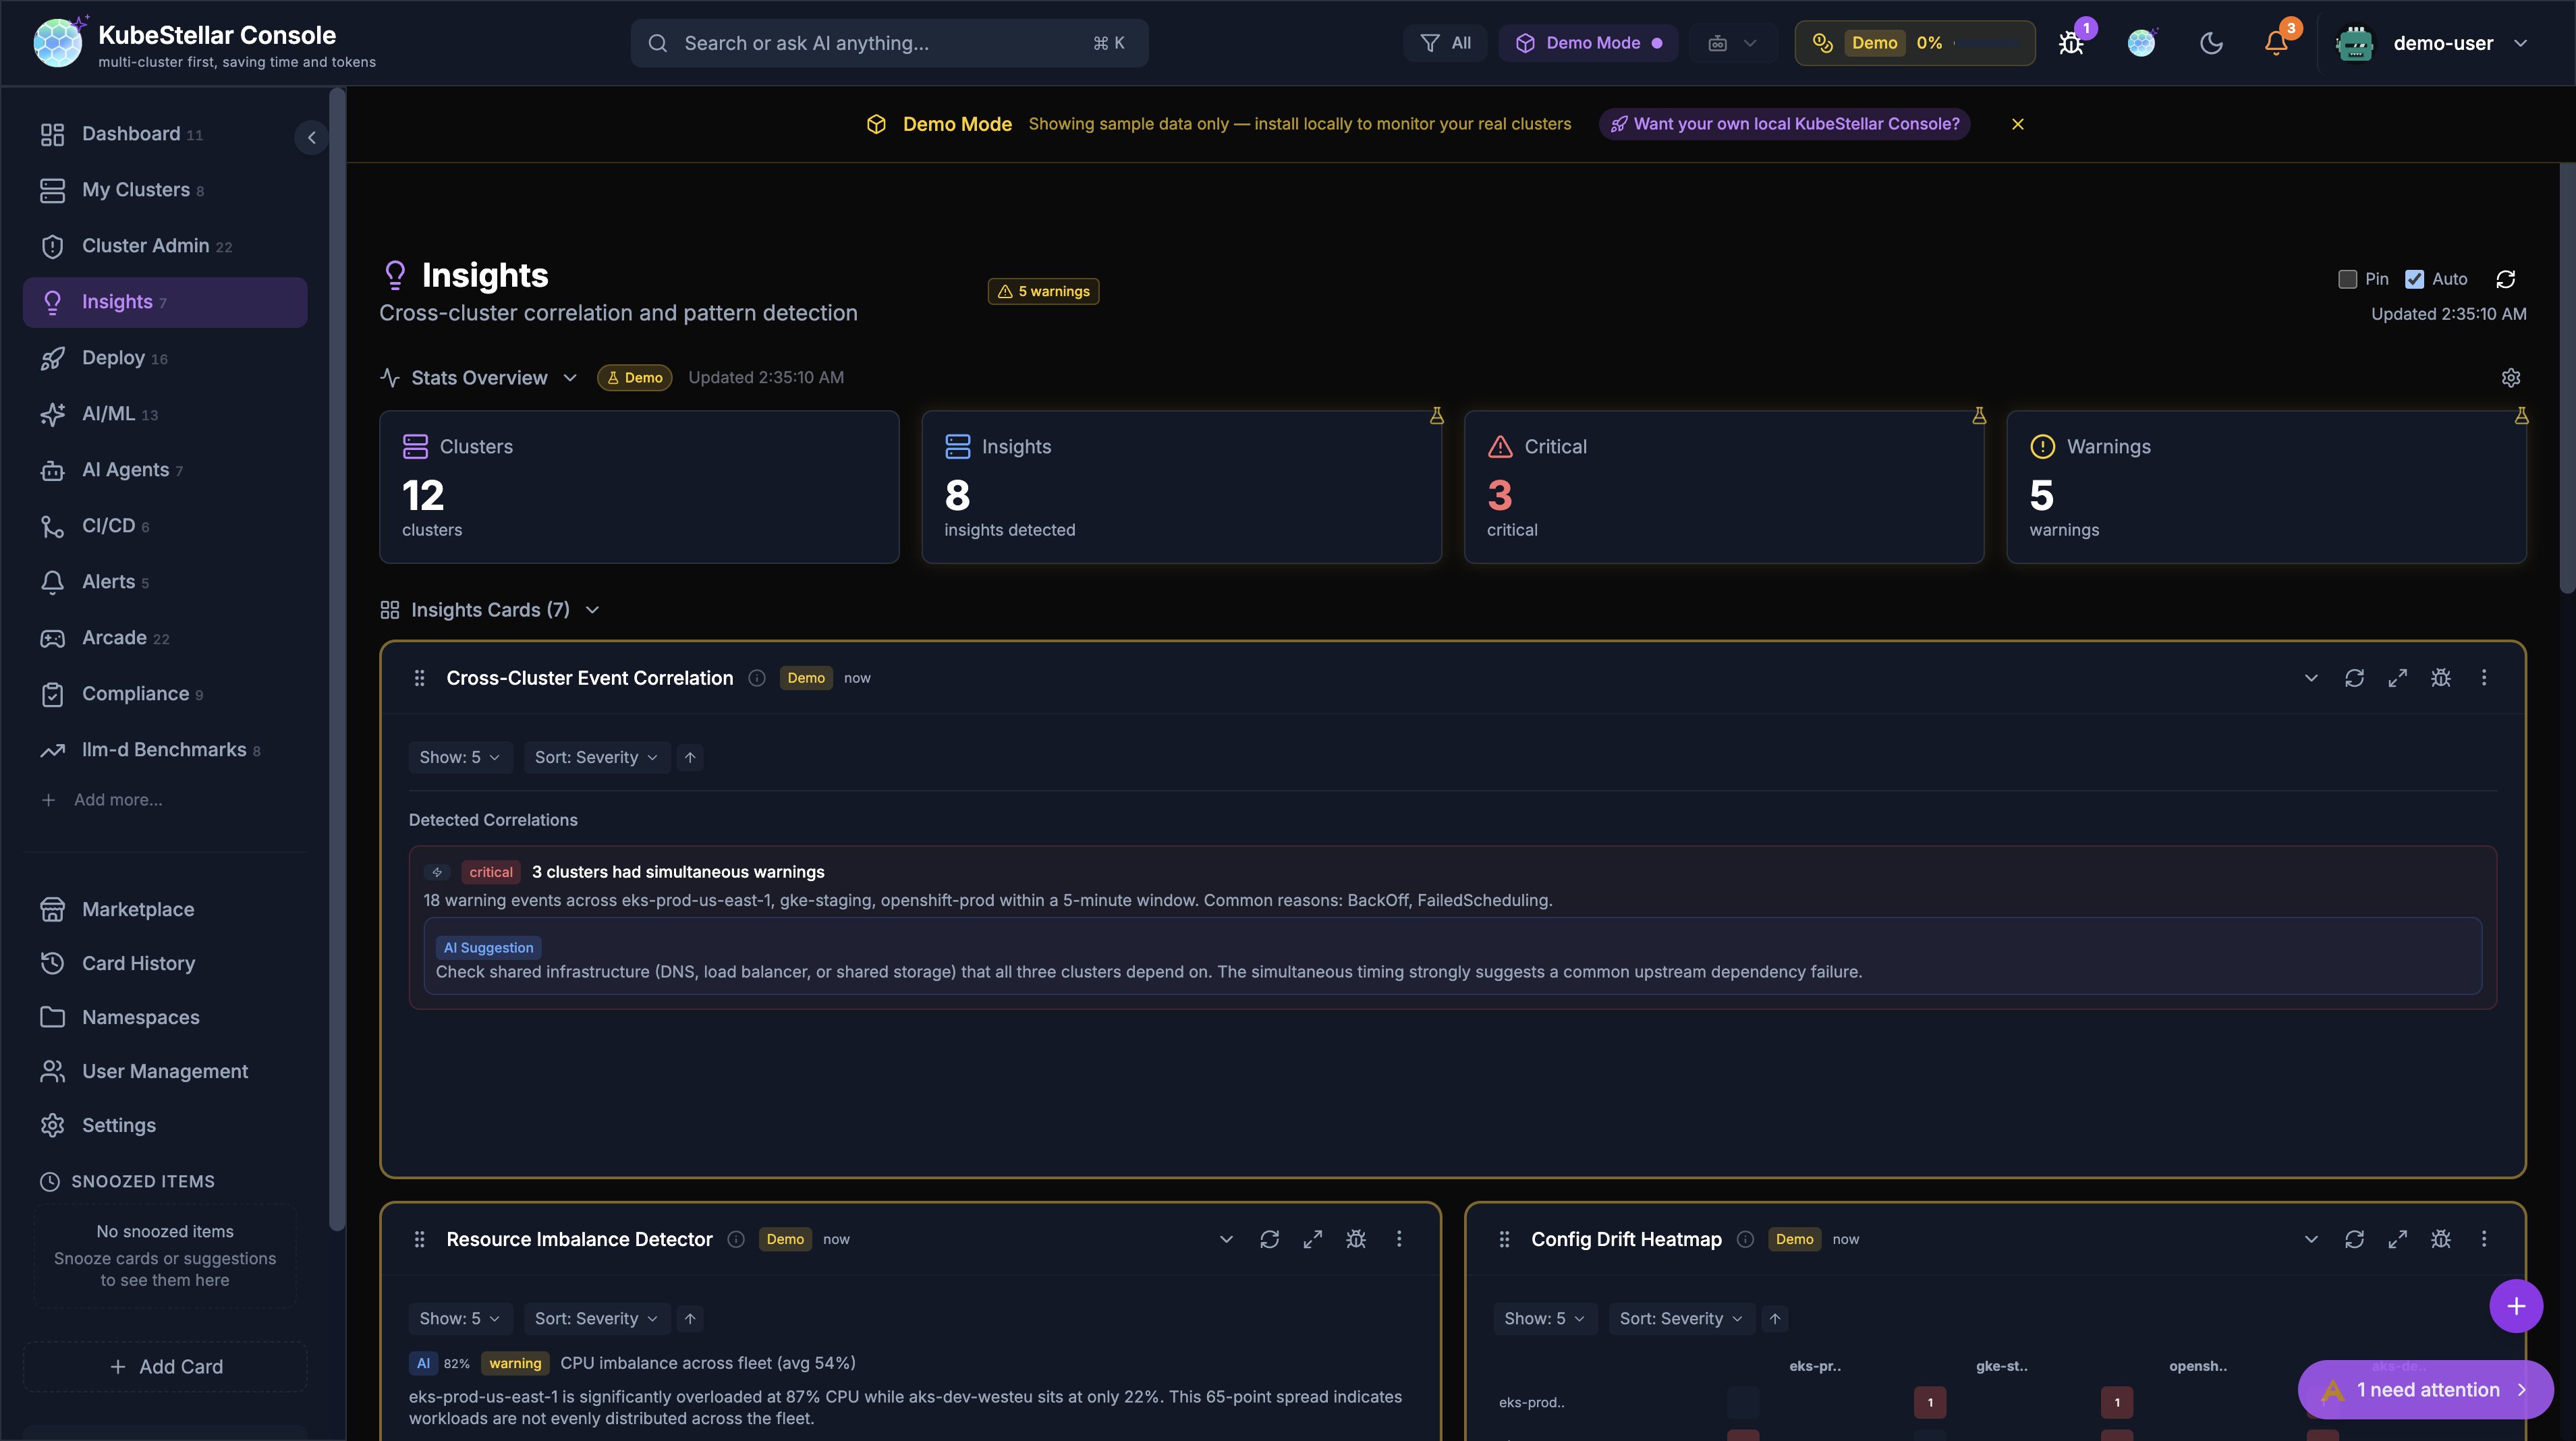
Cross-cluster correlation and pattern detection using heuristic algorithms and optional AI enrichment:
- Stats Overview: Clusters, insights detected, critical count, warnings count
- 7 Insight Cards:
- Cross-Cluster Event Correlation: Detects simultaneous warning events across clusters within a 5-minute window, suggesting common upstream causes
- Resource Imbalance Detector: Identifies CPU/memory imbalances across the fleet (e.g., one cluster at 87% while others sit at 22%)
- Config Drift Heatmap: Visualizes configuration differences between clusters for the same workloads
- Cluster Delta Detector: Tracks changes in cluster state over time, flagging unusual deltas
- Restart Correlation Matrix: Correlates pod restart patterns across clusters
- Cascade Impact Map: Shows how failures in one cluster propagate to dependent services
- Deployment Rollout Tracker: Monitors deployment rollout progress across clusters
- AI Enrichment: When kc-agent is connected, heuristic insights are enriched with AI-generated root cause analysis, remediation suggestions, and confidence scores
- Insight Source Badge: Each insight shows (H) for heuristic or (AI) for AI-enriched
- Remediation Blocks: AI suggestions appear as blue-highlighted blocks with actionable remediation steps
New in March 2026:
- AI enrichment via
useInsightEnrichmenthook with debounced requests, WebSocket broadcast, and TTL cache - Backend
InsightWorkerwith rule-based fallback when no AI provider is connected - Remediation blocks added to all 7 insight cards
- All cards respect global cluster filters
Best for: Identifying cross-cluster patterns that are invisible when monitoring clusters individually
Arcade Dashboard
Route: /arcade
Take a break with Kubernetes-themed games:
- 21 games including AI Checkers, Kube Chess, Container Tetris, Sudoku
- High scores saved locally
- Multiple themes available
Best for: Team building and having fun
Marketplace Dashboard
Route: /marketplace
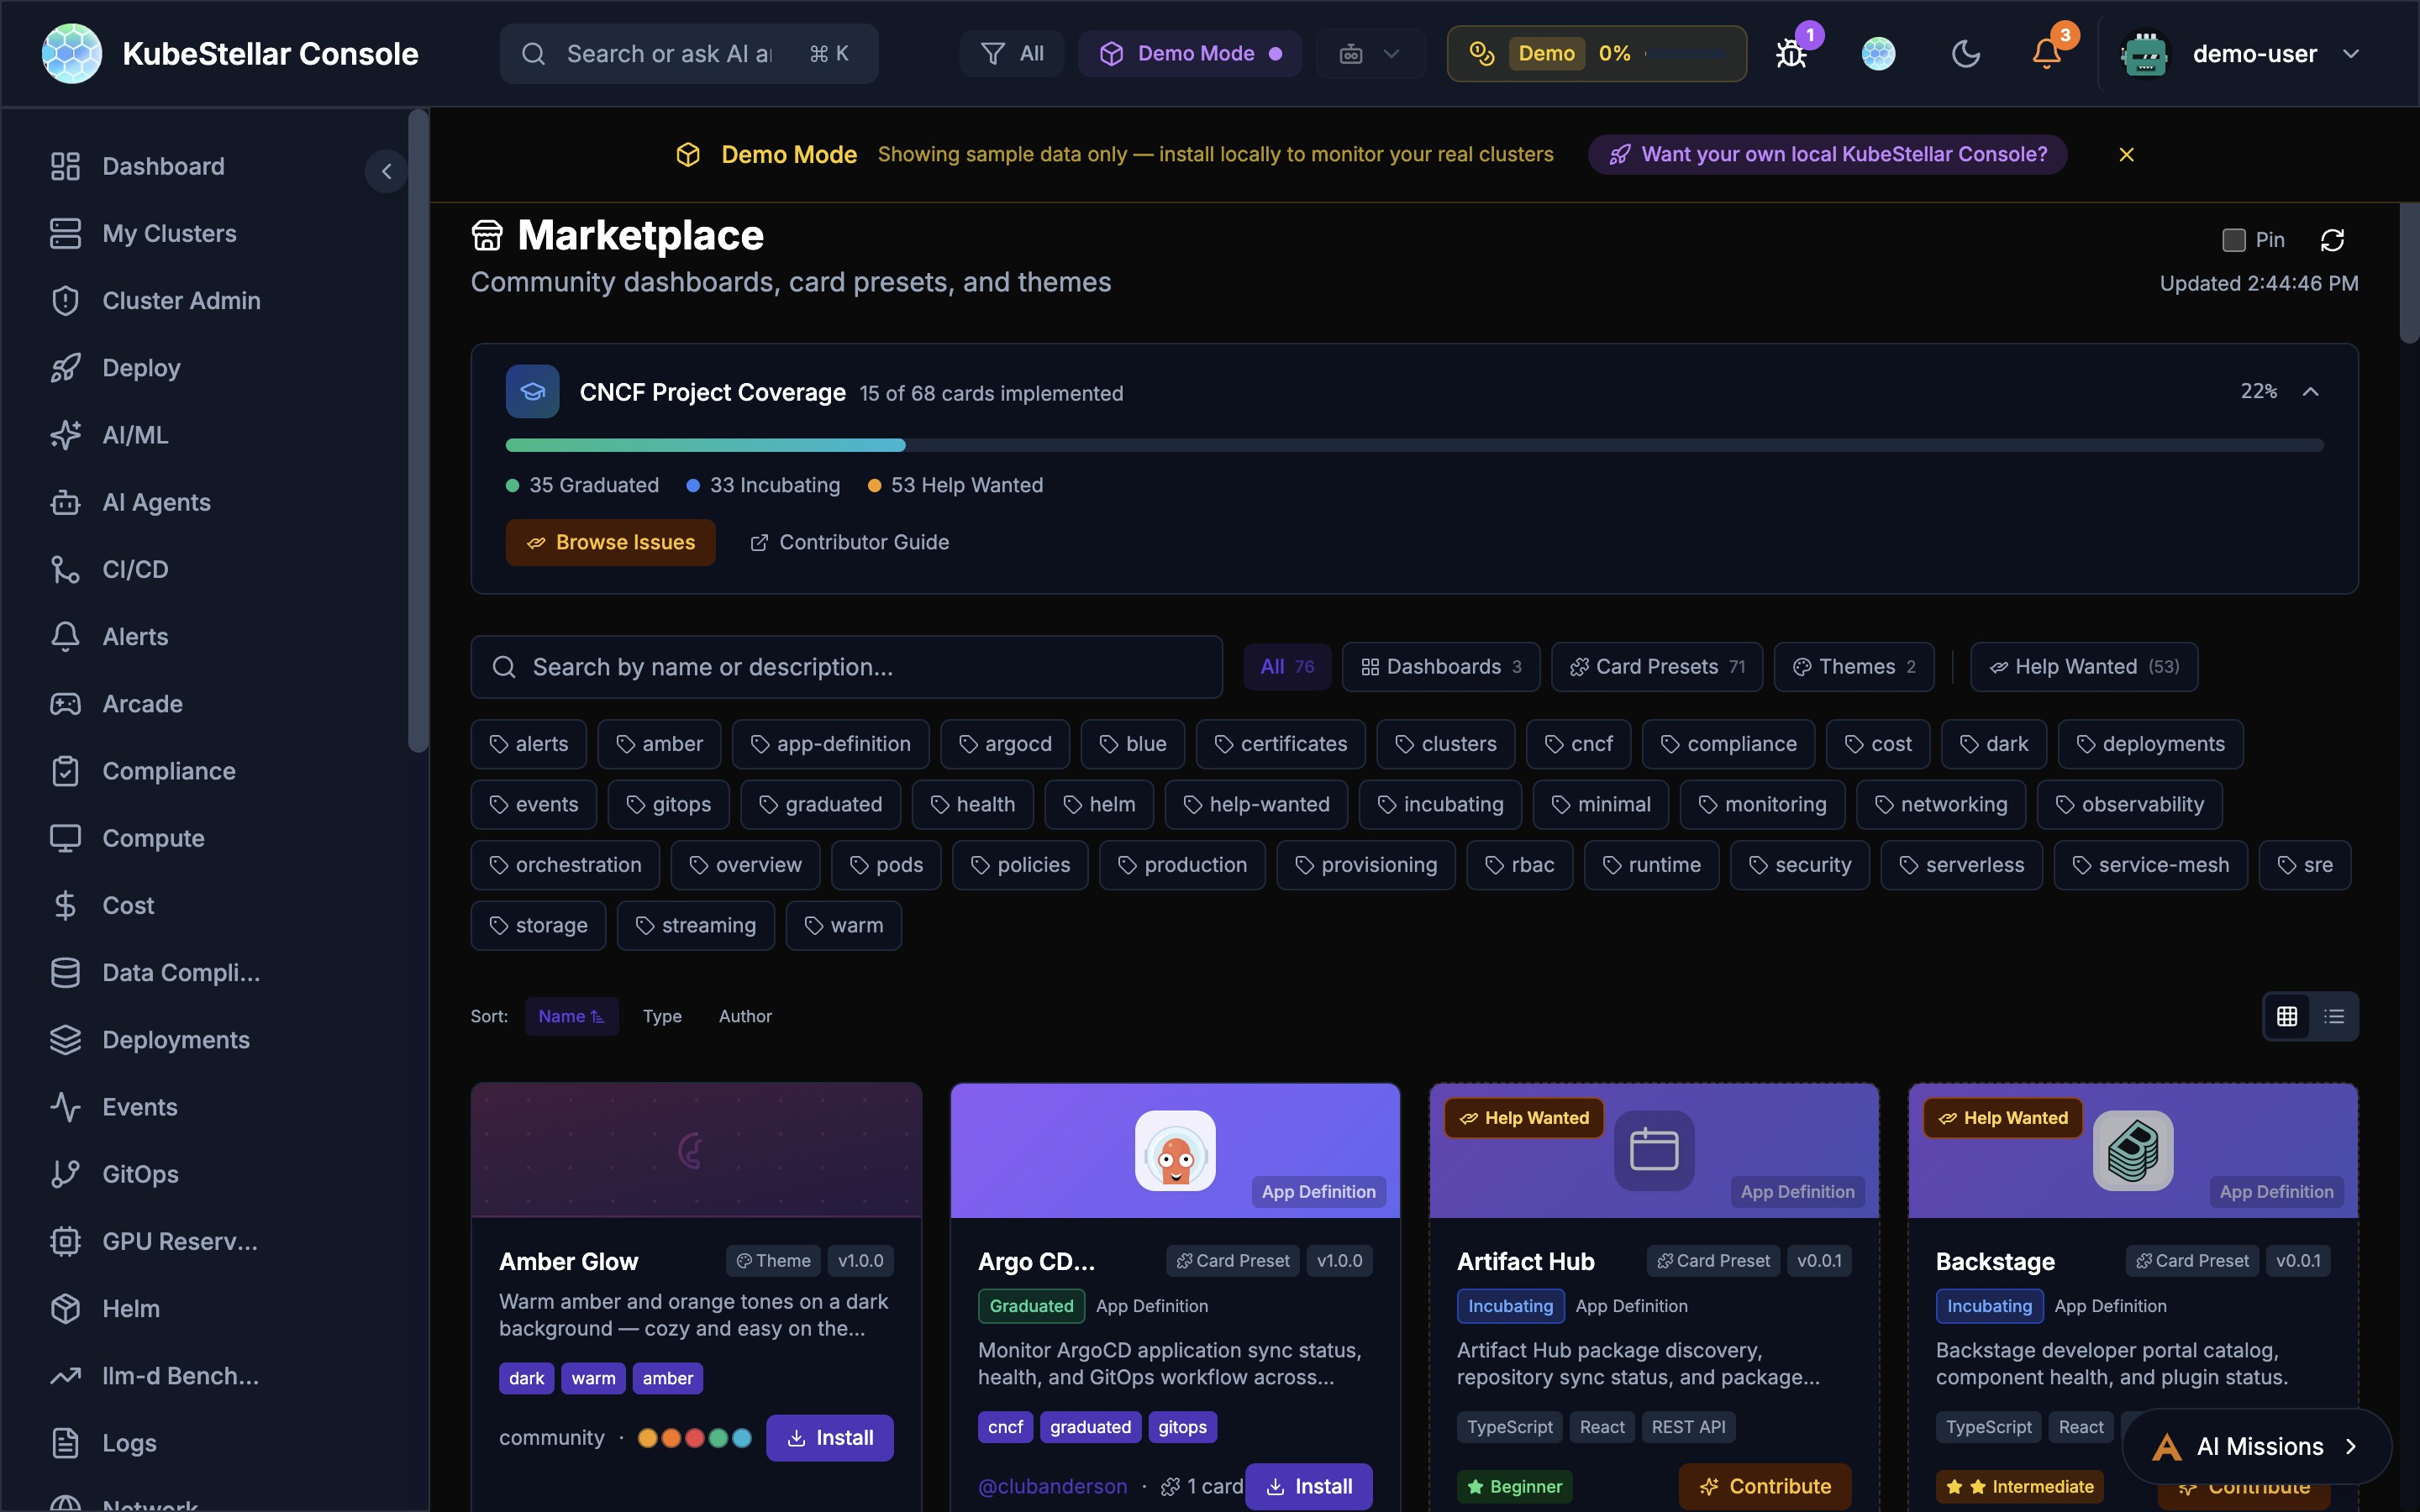
Community dashboards, card presets, and themes:
- Browse and install community-created dashboards (3+ available)
- Card Presets for common use cases (7+ presets)
- Theme marketplace with multiple visual styles (3+ themes)
- CNCF project coverage tracker: 11 of 68 cards implemented (16%), with 35 Graduated, 33 Incubating, and 57 Help Wanted
- Contributor Guide and Browse Issues links for community contribution
- Rich tag-based filtering: alerts, argocd, certificates, clusters, compliance, cncf, cost, deployments, events, gitops, graduated, health, helm, incubating, monitoring, networking, observability, orchestration, pods, policies, production, provisioning, rbac, runtime, security, serverless, service-mesh, sre, storage, streaming, warm
- Sort by Name, Type, or Author
- Grid and list view toggle
Best for: Extending your console with community content
Utility Pages
These aren’t counted as dashboards but are useful:
| Page | Route | What it does |
|---|---|---|
| Card History | /history | See cards you’ve removed |
| Settings | /settings | Configure your preferences |
| User Management | /users | Manage users (admin only) |
| Namespaces | /namespaces | Manage namespace access |
Tips
Customizing Dashboards
Every dashboard can be customized:
- Click “Add Card” to add new cards
- Drag cards to rearrange them
- Click the menu on any card to configure or remove it
- Use the reset button to go back to defaults
Stats Blocks
The stats at the top of each dashboard show the most important numbers. You can configure which stats appear by clicking “Configure stats”.
Auto-Refresh
All dashboards auto-refresh by default. You can:
- Toggle auto-refresh on/off
- Manually refresh with the refresh button
- See when data was last updated